What History Says About Bad Start Years
MCCAIG/E+ via Getty Images
The market had a rough 1st half. What can we expect for the 2nd half?
For this article, I set out to answer the following question: What happens to the market in the 2nd half of the year when the 1st half of the year has a negative return? To find out, I looked at the historical record going back 72 years, to 1950. I separated the years into two groups – those with negative 1st half returns, and those with positive 1st half returns. Here are the negative return years:
Table 1. Years with negative 1st half returns
Negative start years (Author; Yahoo Finance)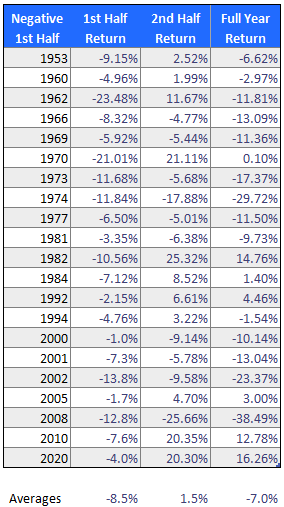
The first observation is that years with a negative 1st half tend to have positive 2nd half returns, although these recoveries are small – just 1.5% on average. That leaves the full-year returns deeply in negative territory – down 7% on average.
Of the 21 years with a negative start, 7 of them recovered fully and posted positive full-year returns. The other 14 years only managed a partial recovery and ended in negative territory for the full year. In other words, it’s twice as likely for a negative start year to end in the red than in the black.
Chart 1. 1st half and 2nd half returns for negative start years
Author; Yahoo Finance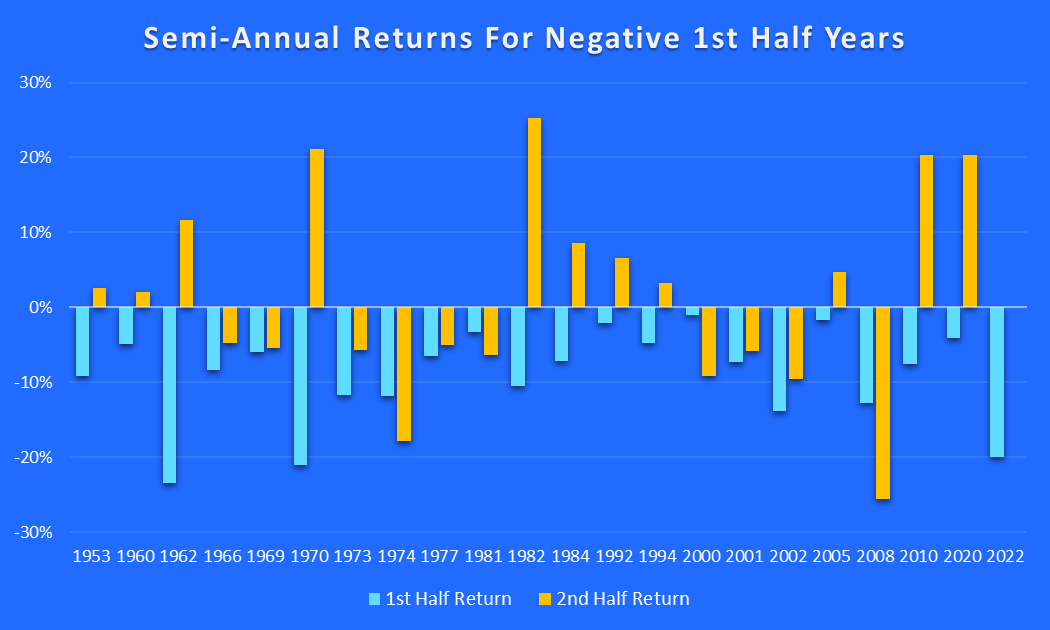
Table 2. Years with positive 1st half returns
Positive start years (Author; Yahoo Finance)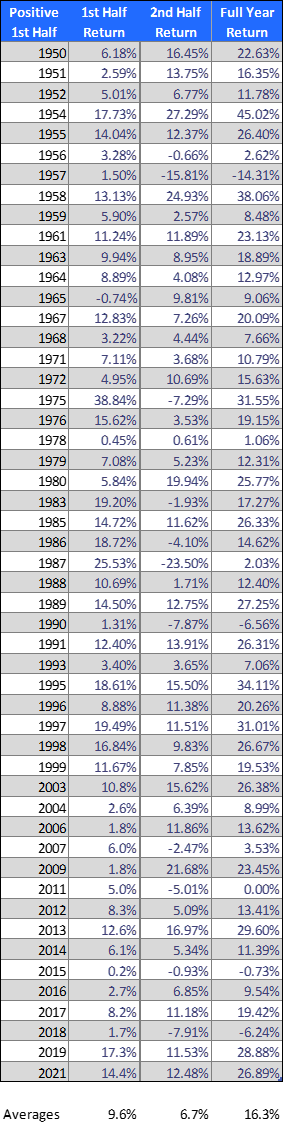
There were 51 years out of the 72 where the 1st half returns were positive. The average 1st half return for these years was 9.6%. The average 2nd half return was 6.7%, and the full-year return for these positive start years was 16.3%.
Clearly, the years with a positive start do better than those with negative starts, on an absolute basis. But on a relative basis, weak years do better in the 2nd half by outperforming their 1st half returns, while strong years underperform in the 2nd half.
There were just two years – 1962 and 1970 – where the 1st half return was a negative -20% or more. 1962 had a 2nd half gain of 11.7% and ended with a full year loss of -11.8%. 1970 had a 2nd half gain of 21.1% and finished the year virtually unchanged.
Takeaways
What I find interesting is the wide disparity of full year returns for these two groups. Years with a good start produce annual returns of 16.3% on average, while bad start years produce -7.0% annual losses on average. If 2022 follows this pattern, which is unlikely, we would end the year at 4464 on the S&P 500.
What other conclusions can we draw from this historical data? Since the sample size is so small, we can’t derive any statistically significant conclusions based on this data alone. History can provide context but markets are forward-looking. We have to consider the characteristics of the environment we find ourselves in today and make some educated guesses about what is likely to happen in the 2nd half of 2022.
It’s likely that the Fed will continue to raise rates and pursue quantitative tightening measures for the rest of this year. A likely result of this Fed policy action will be that economic growth will continue to slow, earnings estimates will come down, and the unemployment rate will tick higher.
None of these things will be good for the stock market, but optimistic investors have a silver lining to cling to – the so-called soft landing, where the Fed manages to get policy just right, bringing inflation down while avoiding a recession. What are the chances of that outcome? I think it’s impossible to predict, but it will be very difficult to pull off.