VXUS: Past Performance Is No Guarantee Of Future Results (NASDAQ:VXUS)
gerenme/iStock via Getty Images
(This article was co-produced with Hoya Capital Real Estate.)
It’s been a rough year for investors, to put it mildly.
In recent articles, I’ve featured the latest stats for the Dow Jones, S&P 500, and Nasdaq indexes. For this introduction, I’ll go a slightly different direction. As of today’s close, June 22, PortfoliosLab shows the classic Stocks/Bonds 60/40 portfolio as being down 17.68% year-to-date.
Foreign vs. U.S. Stocks – A Snapshot and a Wide-Angle View
As it happens, foreign stocks have not been exempted from this decline. In the below graphic, take a look at YTD results for Vanguard Total Stock Market ETF (VTI), a proxy for the total U.S. market and Vanguard Total International Stock ETF (NASDAQ:VXUS), a similar proxy for the total investable foreign market.
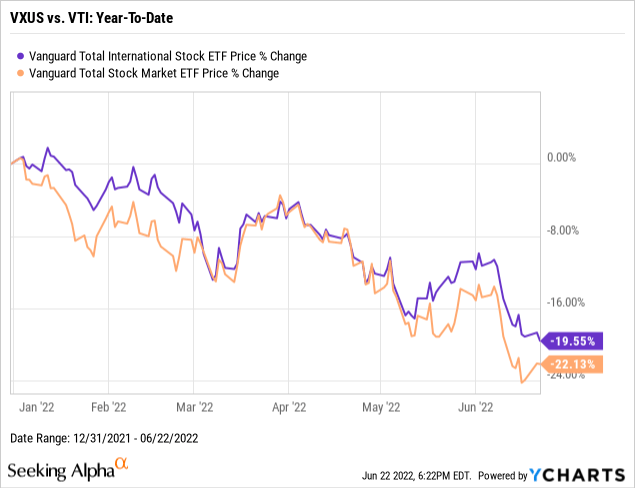
This graphic is the snapshot I referred to in the heading for this section. As can be seen, the results are relatively similar, and none of it is good. It is results like these that cause many investors to stay away from foreign stocks, and an ETF such as VXUS.
Interestingly, though, it is not just because of the lackluster performance of foreign stocks in 2022. Knowledgeable investors know that U.S. stocks have outperformed their foreign counterparts for many years now, and by quite a wide margin.
This is dramatically brought home in this next graphic, where we step back from our snapshot and take in what we might call a wide-angle view. This backtest, from Portfolio Visualizer, analyzes the total return from VXUS and VTI, including reinvestment of all dividends, from January, 2012 through the present. Here’s a handy link if you would like to check the backtest for yourself.
VXUS vs. VTI: 2012-2022 (PortfolioVisualizer.com)
As can be seen, over roughly the last 10 years, VXUS returned a little over 6% per year. Over the same period, VTI returned almost 14% per year.
I already featured that both VXUS and VTI have experienced significant declines this year. Before we leave this section, take note of one more thing. If you look at early-2020, when the market took a severe hit due to COVID-19 shocks, you will note that owning VXUS didn’t provide additional protection from drawdowns as compared to VTI. In fact, if you dig into the details of the backtest I provided, you will find that the Max Drawdown value of 25.54% displayed for VXUS actually spanned a period of over 2 years, from February, 2018 – March, 2020!
Given all of this, here’s the question of the day. Given the fact that the U.S. market has experienced a significant drawdown, and is now well off its all-time highs, should investors go all in on U.S. stocks in an attempt to recover from this downturn? Or is there still a place for foreign stocks in your portfolio? If foreign stocks have clearly underperformed and, on top of that, apparently don’t offer additional downside protection, why should they even be considered?
Foreign Stocks – Perspectives From a Vanguard Study
I recently wrote an article cautioning investors against falling victim to recency bias, which has been defined as “the unfounded conviction that recent trends will continue into the near-term future.” In addition to my personal view, the article features how foreign stocks play a prominent role in, for example, professionally-managed Vanguard target-date retirement funds.
However, as I researched this article, I decided to attempt to investigate the “whys” of the recent underperformance of foreign stocks as compared to their U.S. counterparts. Happily, I came across an excellent Vanguard white paper that performed a sum-of-the-parts breakdown to explain the differences.
Before we go any further, there is one caveat that I should share. The paper, written in late-2020, took a look at the 10 years ending December 31, 2019. In other words, the data is approximately 2-1/2 years old at this point. However, I might make the observation that in those 2-1/2 years, the trend has actually intensified in favor of U.S. stocks. My takeaway from this? The arguments in favor of including an allocation to foreign stocks are, if anything, even stronger at this point in time.
One by one, let’s go through 4 of the very helpful graphics from that white paper.
In this first graphic, the “delta” or variance between the 13% return for U.S. stocks and the 5.1% return for foreign stocks is broken out into components.
Components of U.S. vs. Foreign Stock Performance Differences (Vanguard Research)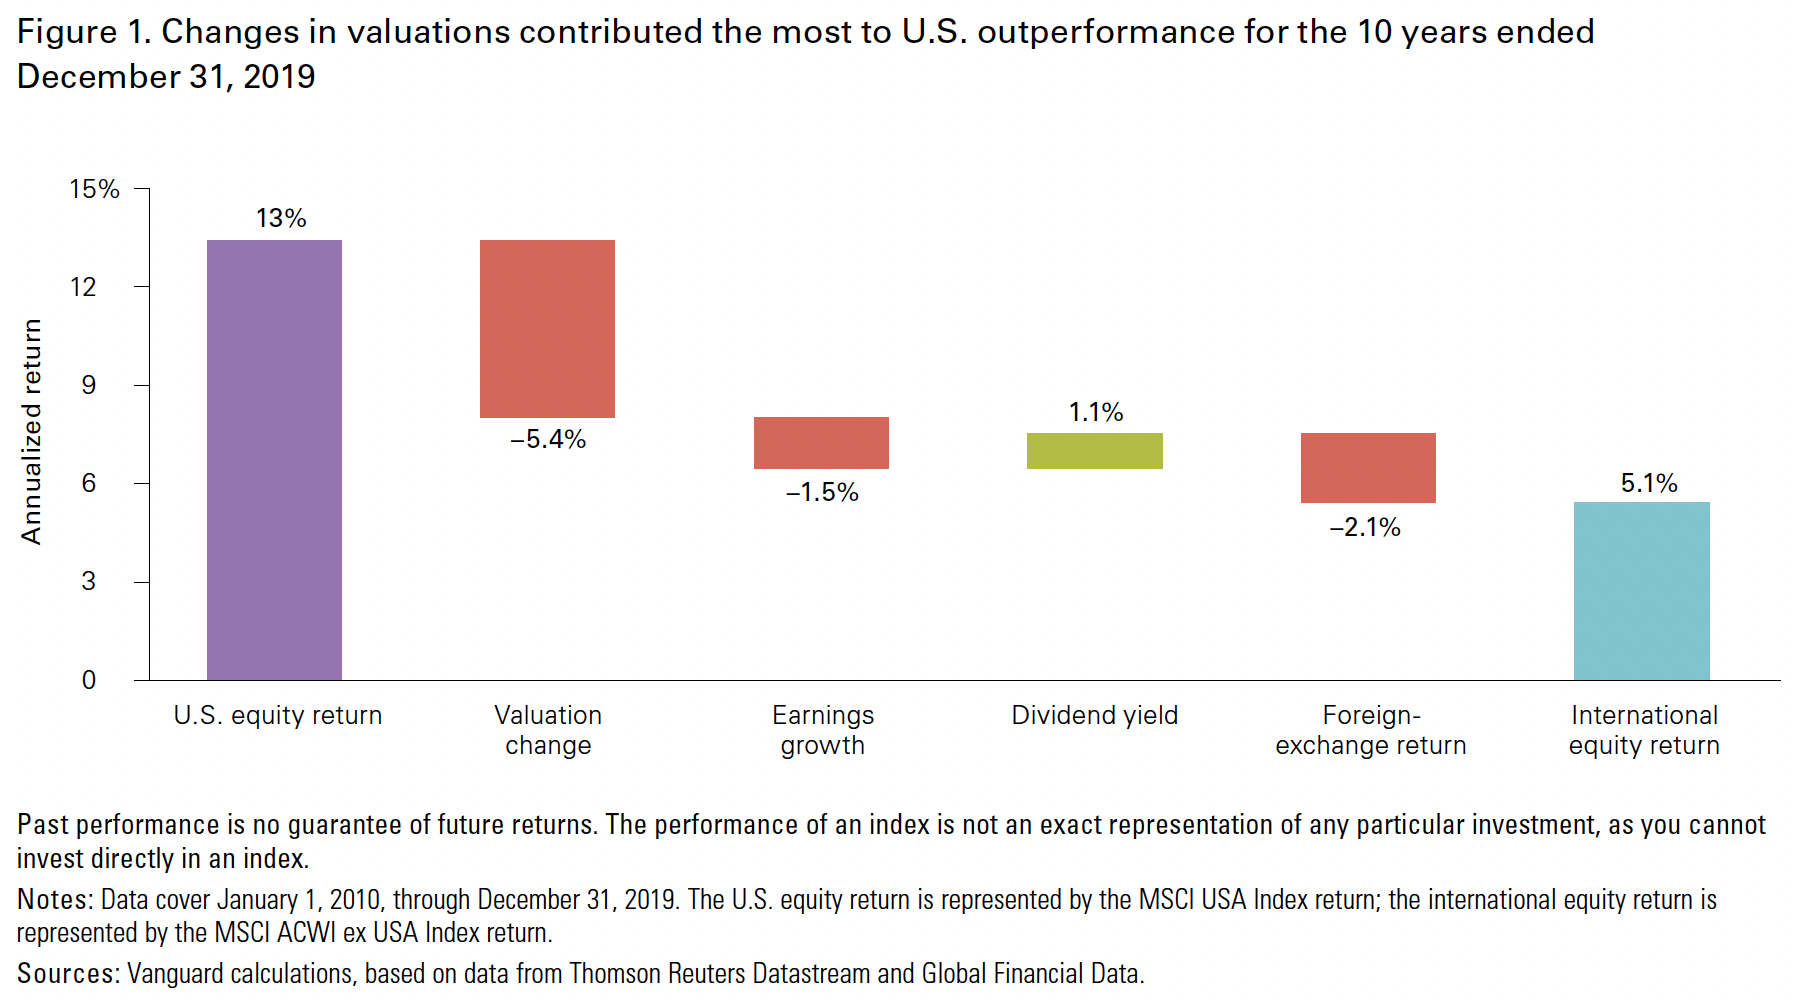
The first thing the article features is that, over the past 10 years, nominal U.S. GDP growth has exceeded international growth by an average of 1.8 percentage points per year on a market-capitalization-weighted basis.
As a result, not only is U.S. earnings growth, at 1.5%, a contributing factor to the outperformance of U.S. stocks, the valuation given U.S. stocks as a result of this contributed a much larger 5.4% to the variance. Additionally, during the decade in question, it can be seen that a strong U.S. dollar contributed to a 2.1% loss to returns to international assets held by a U.S. investor.
Interestingly, the one positive variance in favor of foreign stocks related to dividend yield, with a 1.1% advantage. The exceedingly strong performance of U.S. growth stocks, which typically pay little or no dividends, contributed to foreign stocks yielding a higher payout in terms of dividends.
Our second graphic has to do with a rather notable jump in U.S. profit margins during the decade of 2010 – 2019.
Corporate Profit Margin Differences (Vanguard Research)
While Vanguard notes that all of the reasons for this are not 100% clear, it offers this observation:
This increase could be caused by globalization; it occurs less than 10 years after the North American Free Trade Agreement (NAFTA) went into effect and corresponds with both a rise in U.S. imports and exports as a percentage of GDP and China’s inclusion in the World Trade Organization (WTO).
In combination, the first two graphics help to shed some light on the outperformance of U.S. stocks over this period.
However, at the time of this white paper, Vanguard did not expect that to continue. As can be seen in our 3rd graphic, Vanguard projected an average annual return of only 4.7% for U.S. stocks for the decade ending December 31, 2030, while foreign stocks were expected to average annual returns of 8.1%.
Projection: Components of U.S. vs. Foreign Returns (Vanguard Research)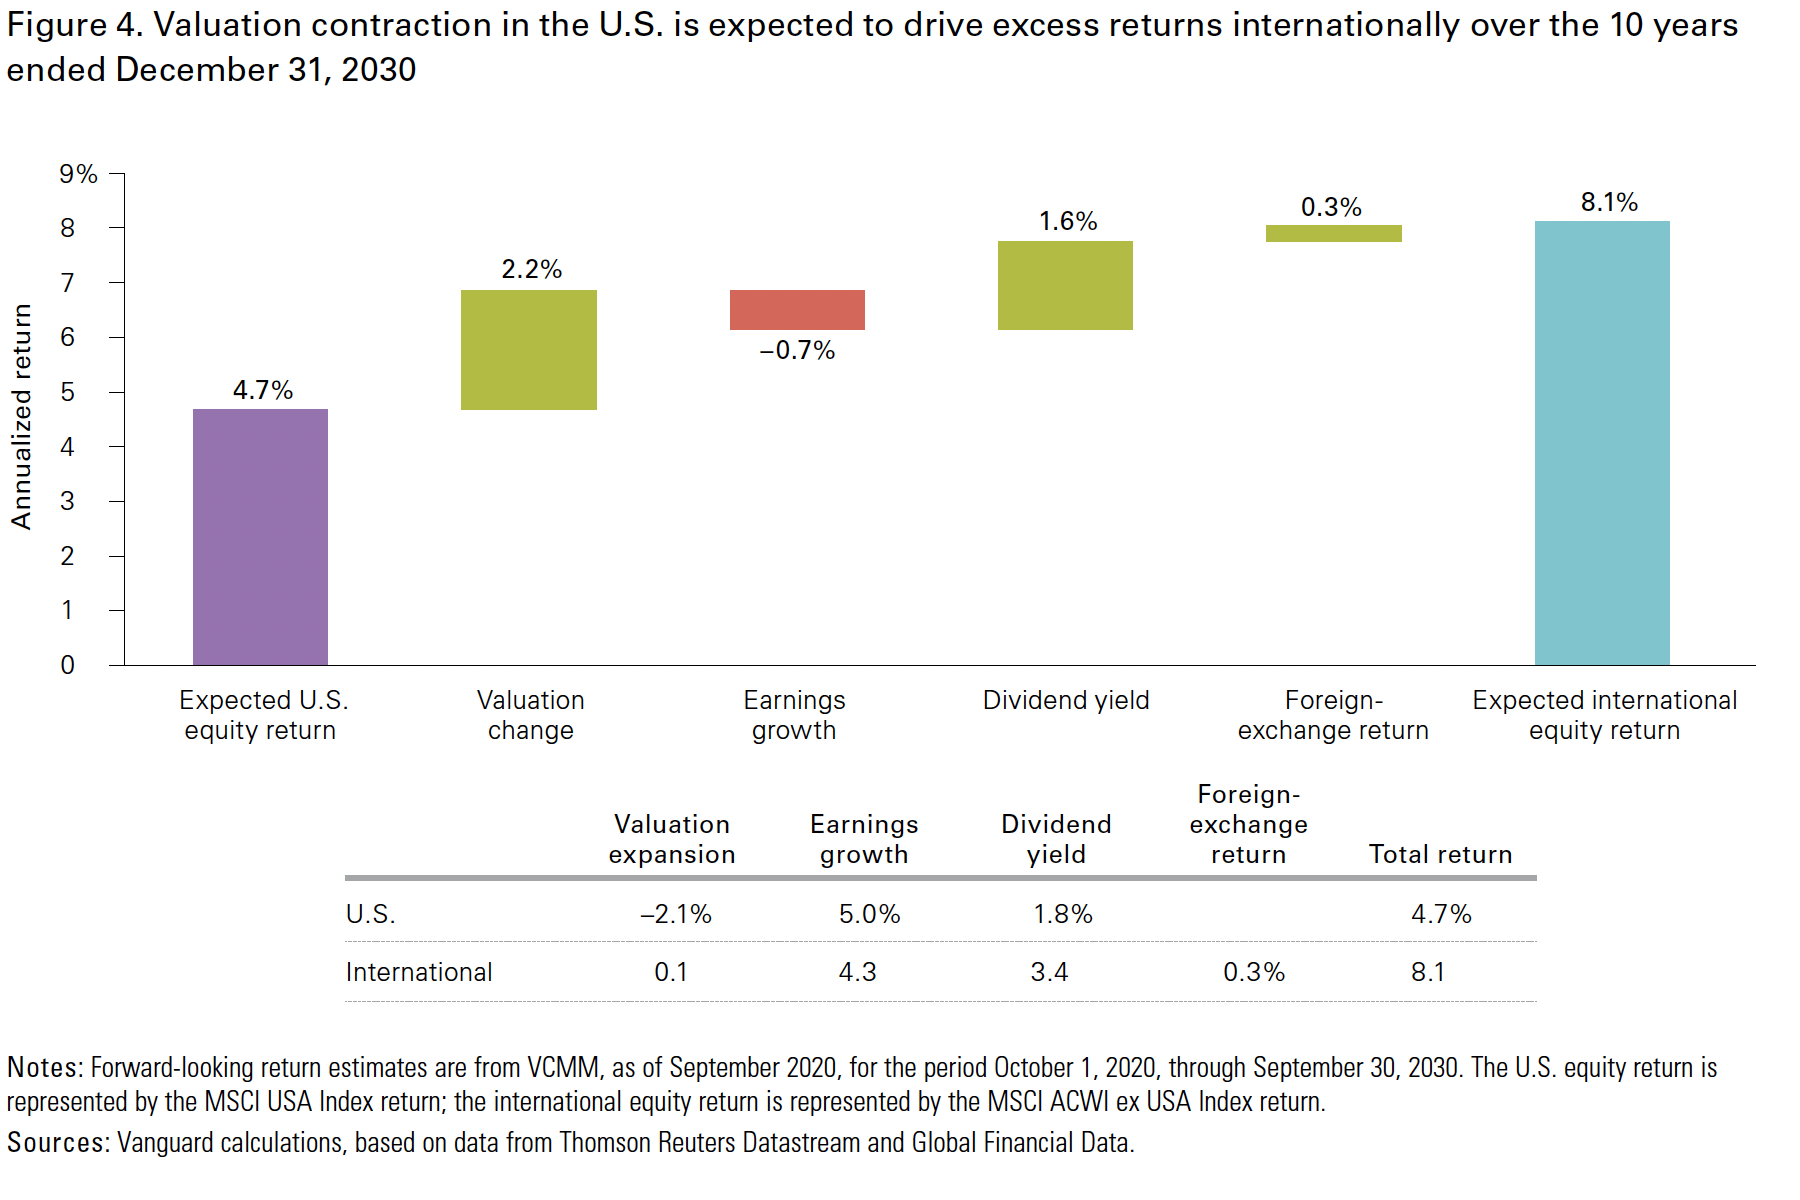
Please look carefully at the above graphic. What you might find interesting is that Vanguard still projects U.S. earnings growth to outpace that of international growth (5.0% vs. 4.3%). You can also see that value reflected in the -0.7% value (reddish-brown bar) in the chart. So it’s not that the earnings power of U.S. stocks will fall off a cliff.
What, then, would account, for the proposed superior returns in foreign stocks?
Simply put, the starting point. Vanguard suggests that the higher initial valuations of U.S. equities will be a tailwind moving forward.
U.S. vs. Foreign Stocks: Where Are We Now? (Vanguard Research)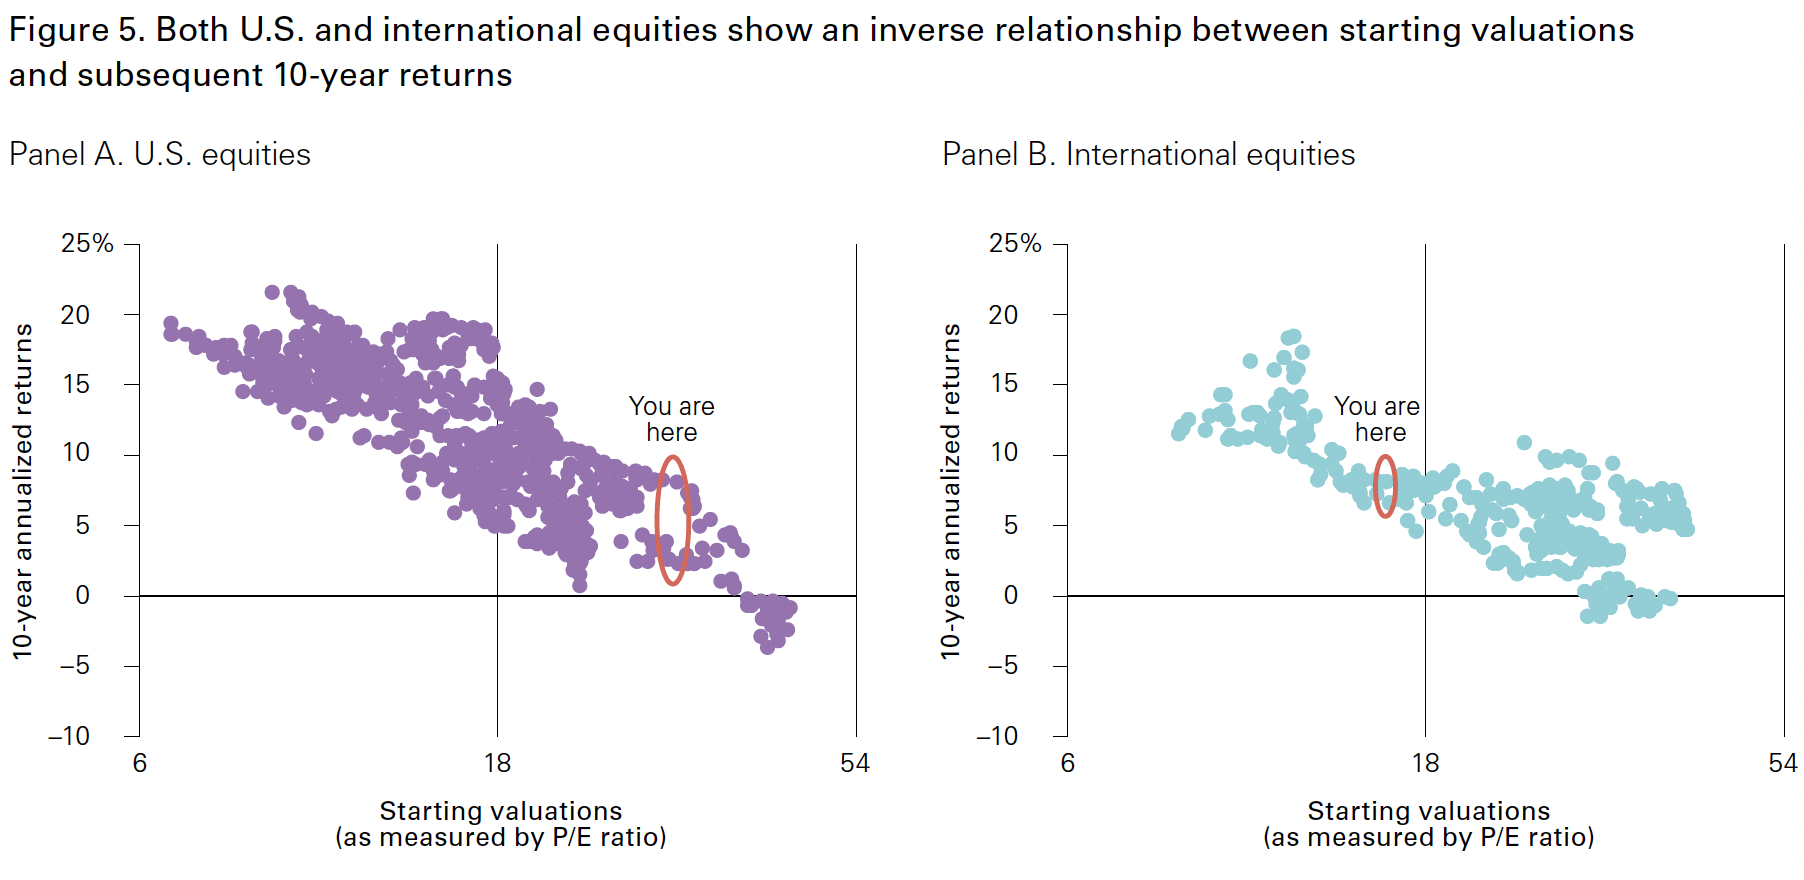
The graphic above might prove a little difficult to interpret. I’ll try to help. The x-axis, or horizontal line displays the starting P/E ratio for the stocks in question; the farther to the right you go, the higher the value. The y-axis, or vertical line, represents the annualized returns for the following 10-year period.
The basic takeaway? The higher the starting value, the lower, in general, the returns over the next 10 years.
As can be seen, the starting P/E value for U.S. stocks is a lot higher, or further to the right. As a result, generating those same high returns moving forward is, statistically, much more unlikely. With foreign stocks the odds are more in your favor.
Putting It All Together – And Looking Back Even Further
What did you think of my article title?
I borrowed the famous phrase “past performance is no guarantee of future results.” In general, that has a negative connotation, doesn’t it? Sort of the investor’s caveat emptor of “let the buyer beware,” if you will.
But, in the case of investing, that can work two ways. In some cases, the forward-looking outlook might be positive. In addition to the projection from the Vanguard white paper, is there any historical precedent for believing this could happen in the case of foreign stocks?
To answer that question, have a look at a second backtest, from Portfolio Visualizer. In this case, instead of picking ETFs as proxies, I picked asset classes, because data is available much further back if you come at it from that direction.
U.S. vs. Foreign Stocks: Returns from 1986-2022 (PortfolioVisualizer.com)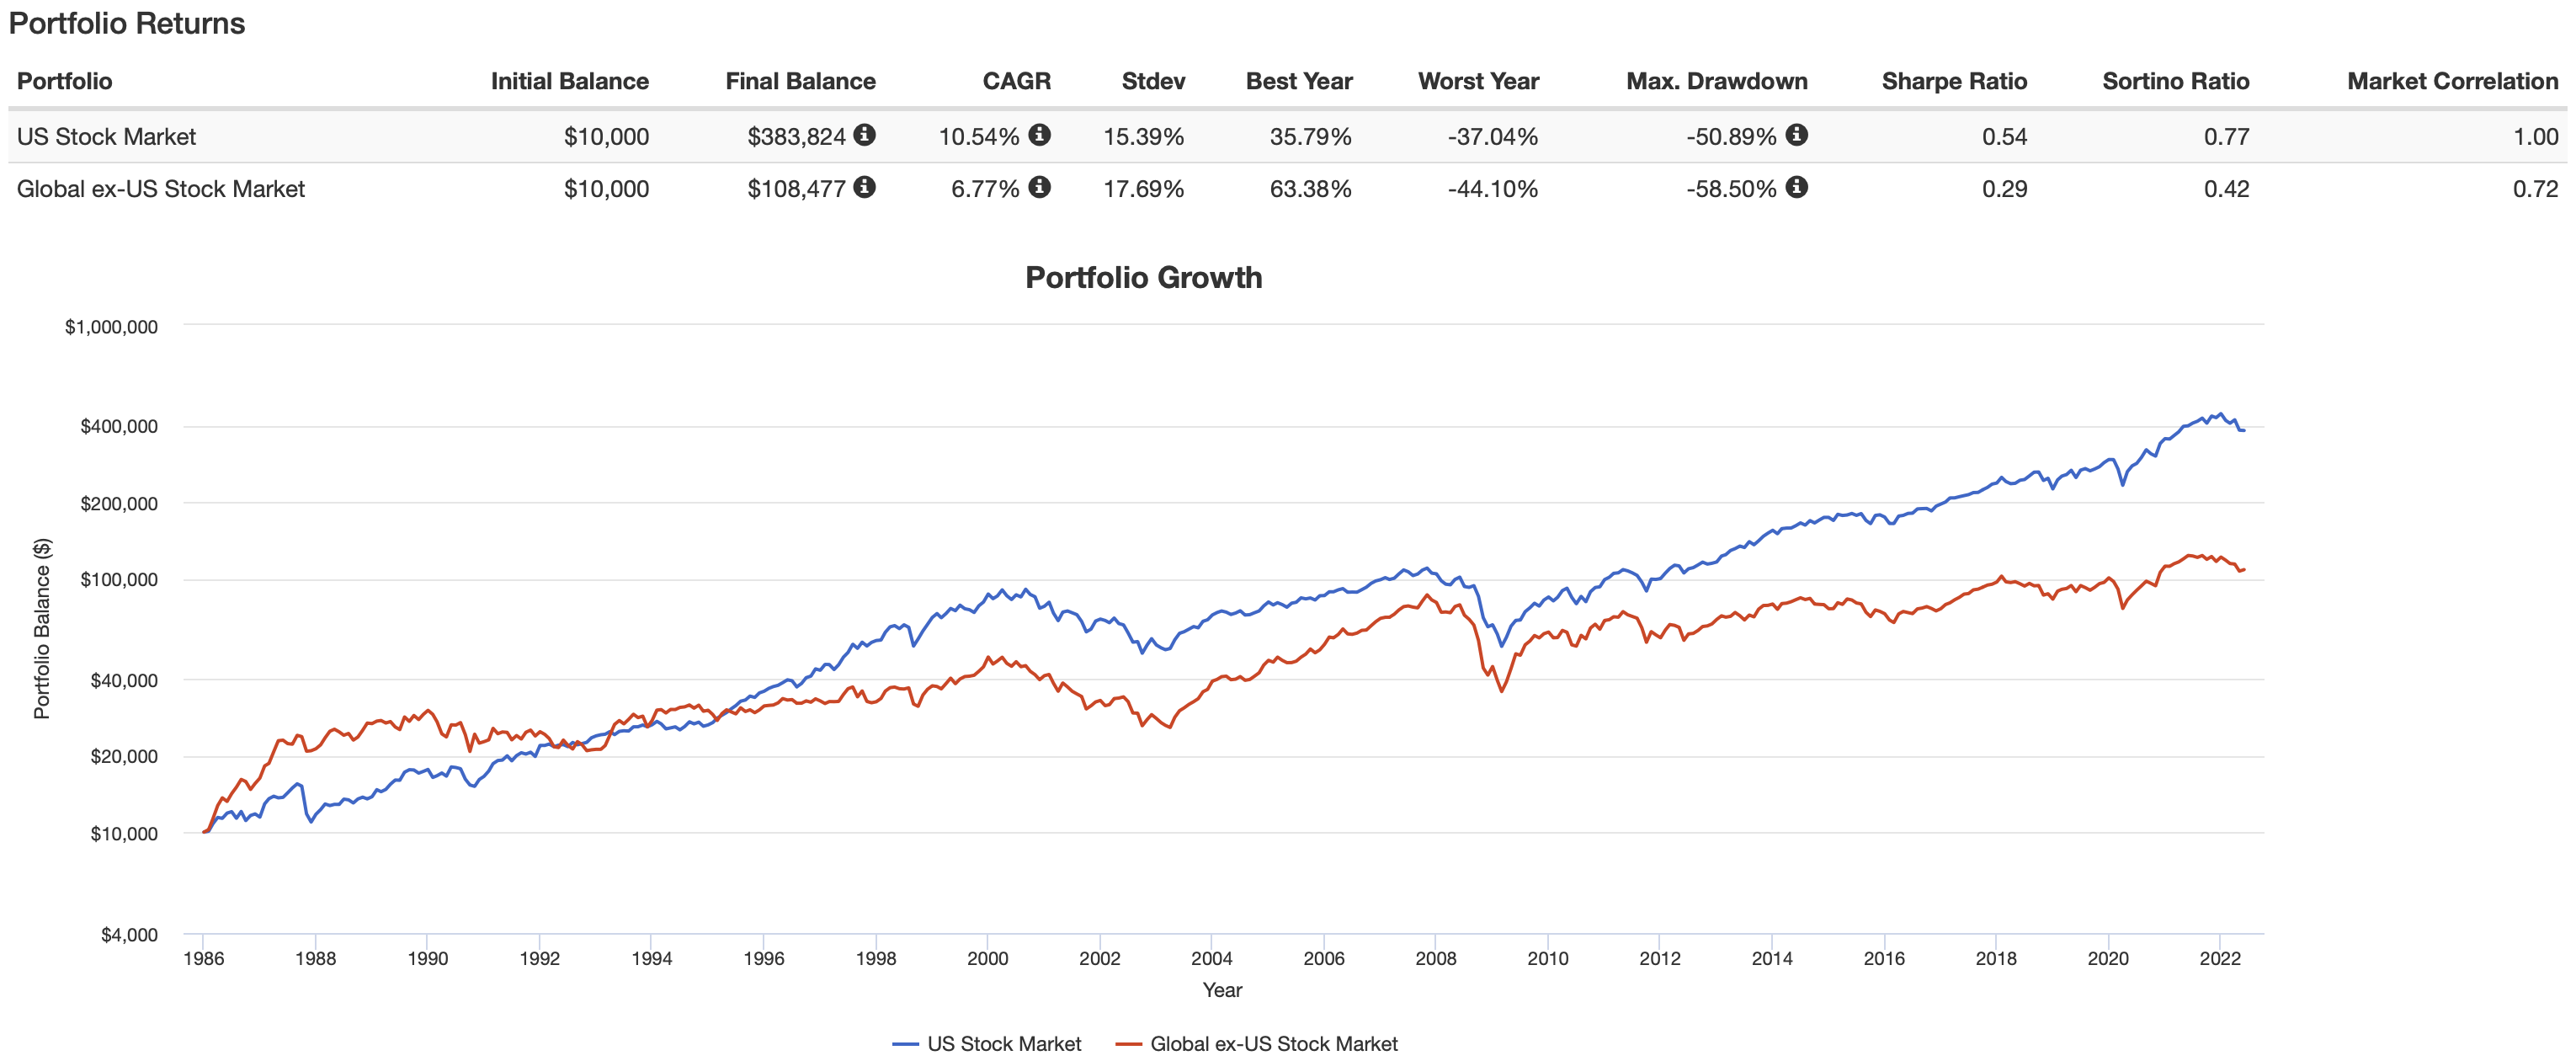
Here’s how it played out.
- From 1986-1988, foreign stocks absolutely trounced U.S. stocks.
- From 1989-1992, U.S. stocks had the upper hand.
- From 1993-1994, foreign stocks again took the lead.
- From 1995-2001, U.S. stocks again trounced foreign, with a brief exception in 1999.
- From 2002-2009, foreign stocks led far more often than they trailed.
- In general, U.S. stocks have carried the day ever since, as can clearly be seen in the widening divide between the blue and red lines in the last graphic above.
Over that 36-year period, it becomes clear that, while U.S. stocks have outperformed in total, there have been multiple occasions when the tide has swung in favor of foreign stocks, and for periods of years at a time.
With all of that said, we come full circle back to VXUS, the featured ETF of this article.
In a nutshell, if you find yourself in agreement with this analysis, and are desirous of including some allocation to foreign stocks in your portfolio, VXUS is perhaps your preeminent choice.
This beautiful combination graphic from right here on Seeking Alpha captures it nicely.
VXUS: Sector Breakdown & Top 10 Holdings (Seeking Alpha)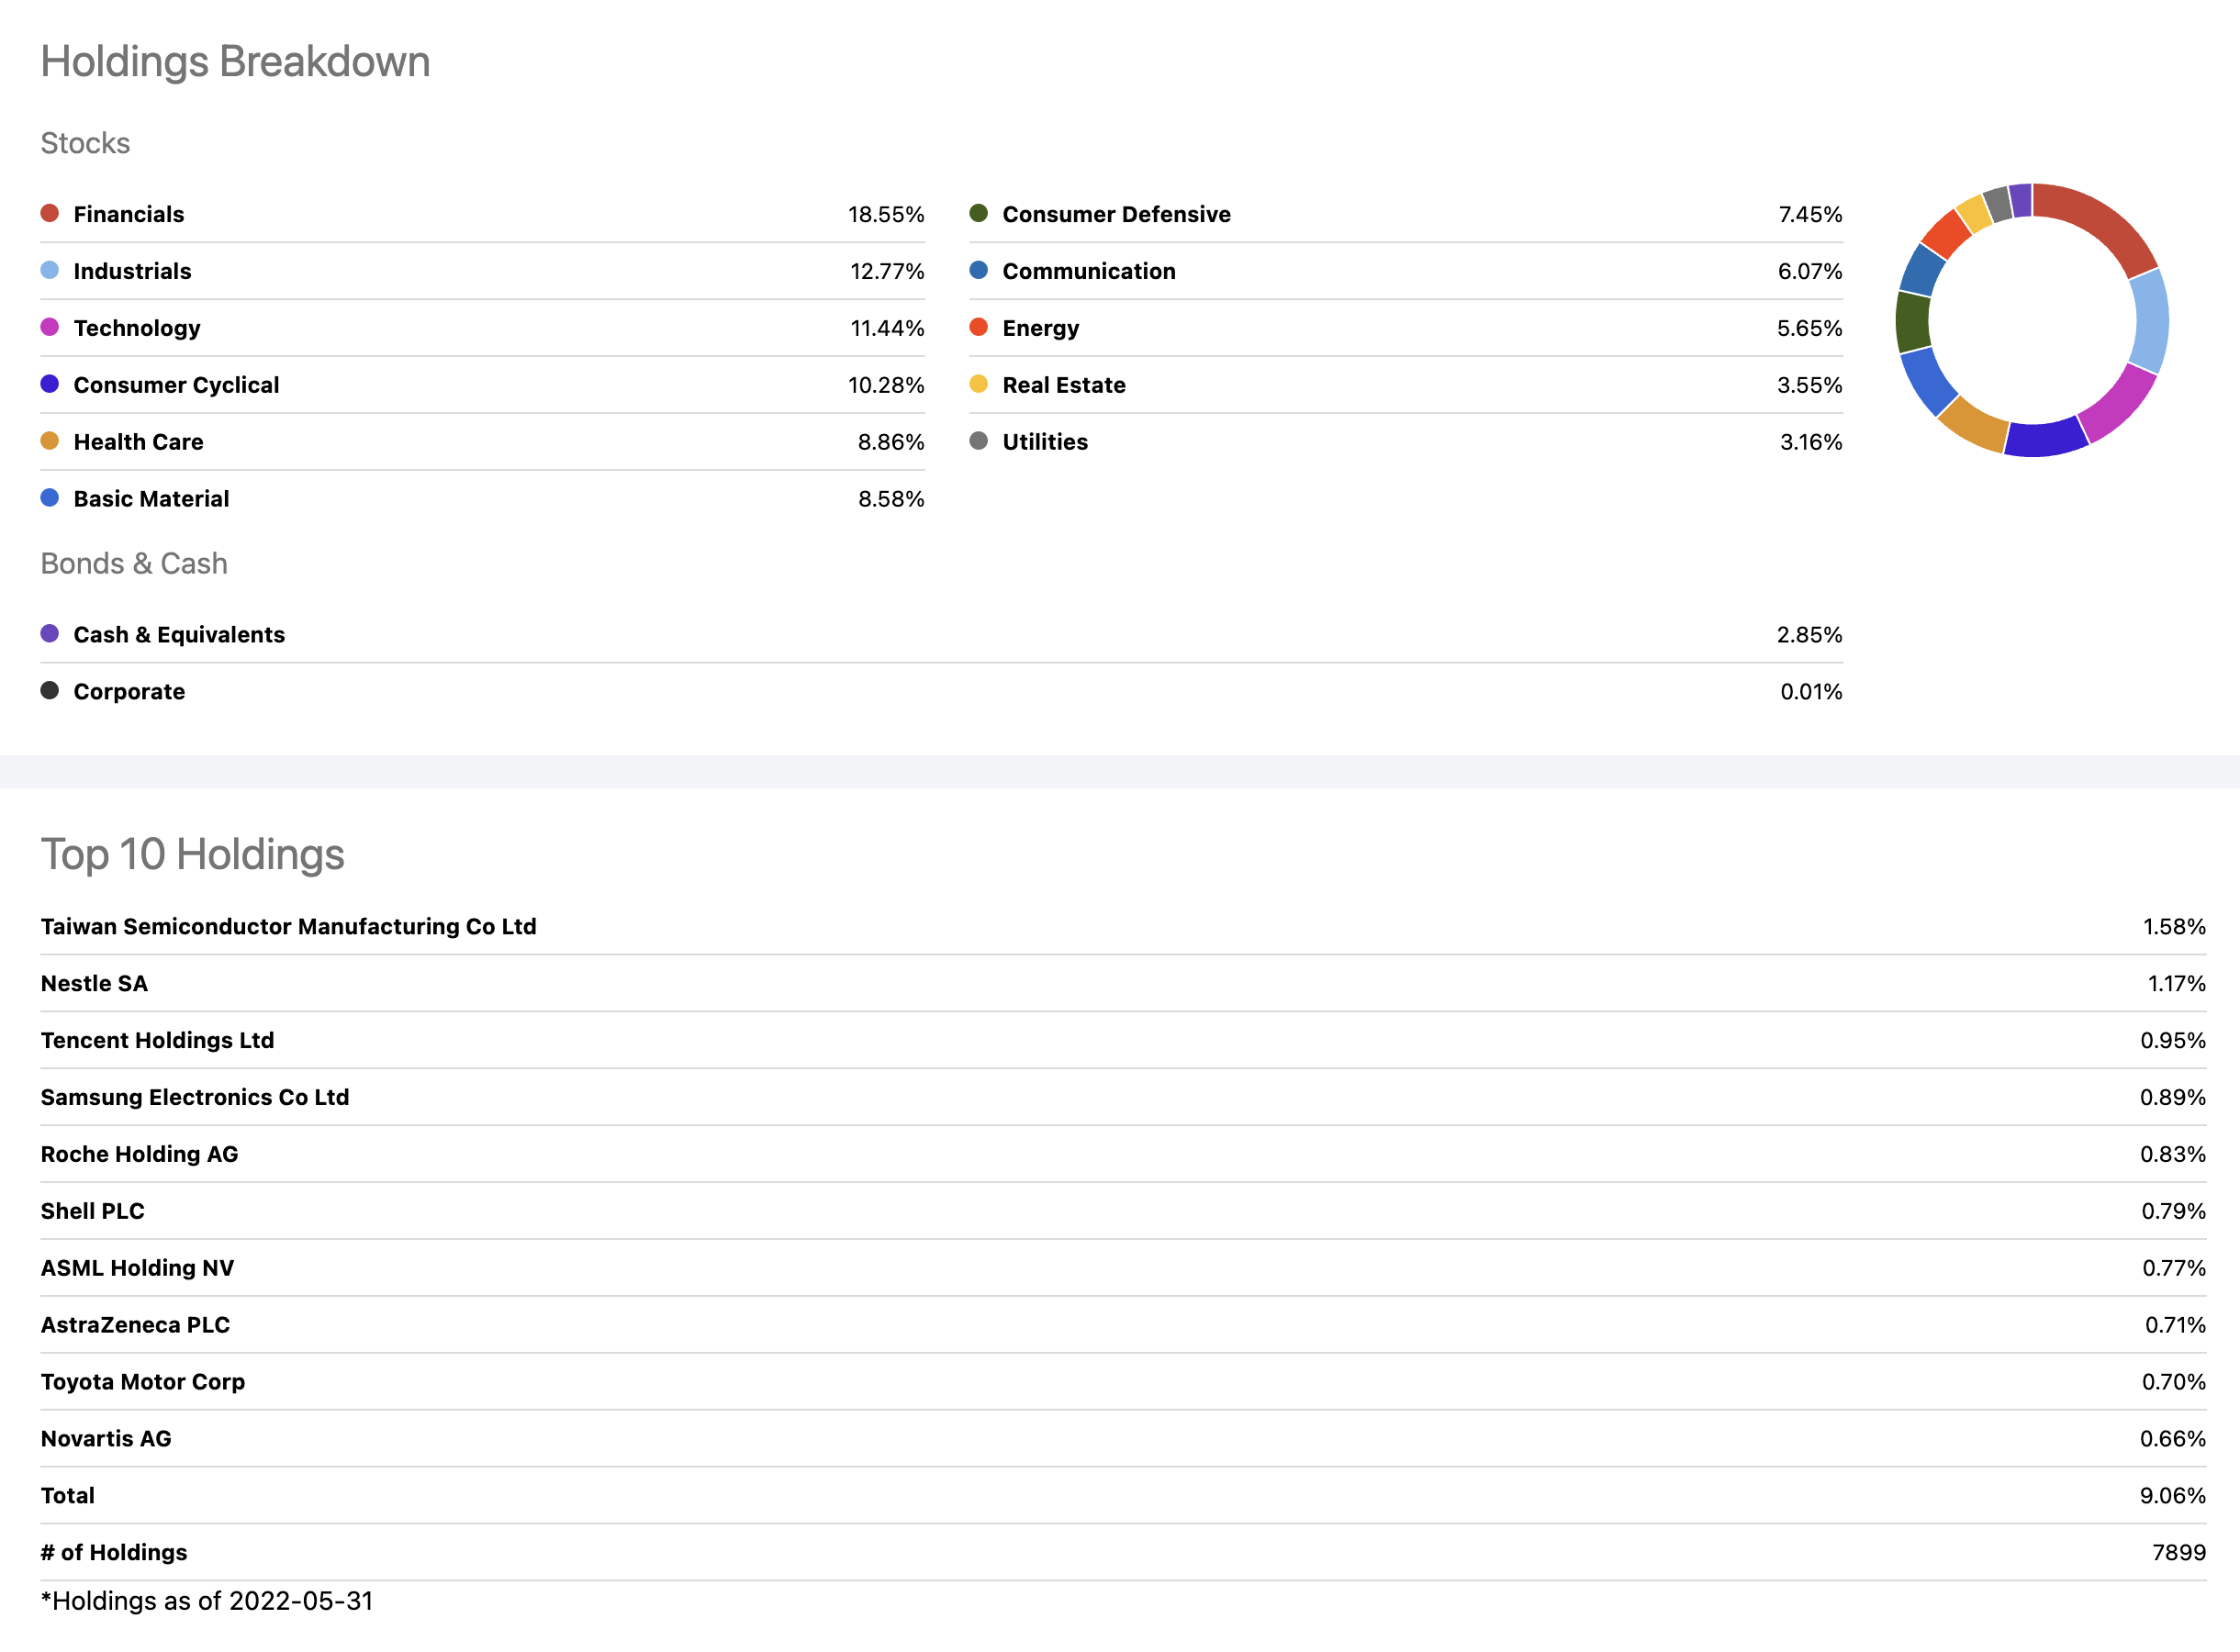
VXUS offers you exposure to almost 8,000 stocks outside the U.S., across the entire spectrum of size; small-, medium-, and large-caps. And it does all of this at a rock-bottom expense ratio of .07%.
I hope you have found this article interesting. Please, feel free to share your comments, questions, and yes even criticisms in the comments section below.
Until next time, I wish you…
Successful investing!