UPS: The Fall Is Not Over (NYSE:UPS)

Alex Wong/Getty Images News
Investment Thesis
United Parcel Service (NYSE:UPS) stock has struggled to regain its bullish bias since reaching its all-time highs in February. Notwithstanding, UPS’s defensive profile has helped it outperform the SPDR S&P 500 ETF (SPY) YTD.
However, the company’s revenue and profitability growth likely peaked in FY21. As a result, the consensus estimates suggest significant moderation through FY24. In addition, our valuation model indicates that UPS is unlikely to meet our revenue target through FY26. As a result, UPS could likely underperform moving forward.
Our price action analysis indicates a potent double top bull trap (significant rejection of buying momentum) had formed in February 2022, which preceded its steep decline over the past few months.
Since mid May, UPS has been consolidating close to its near-term support ($165). However, given its prior double top, we don’t believe its near-term support could hold. Also, UPS is in a bearish bias, with considerable selling pressure close to its near-term resistance ($185). Therefore, we believe a subsequent bull trap could form to force a rapid liquidation in a steep sell-off.
Accordingly, we rate UPS as a Sell and suggest investors use the recent rally into its near-term resistance to cut exposure.
Growth Is Normalizing
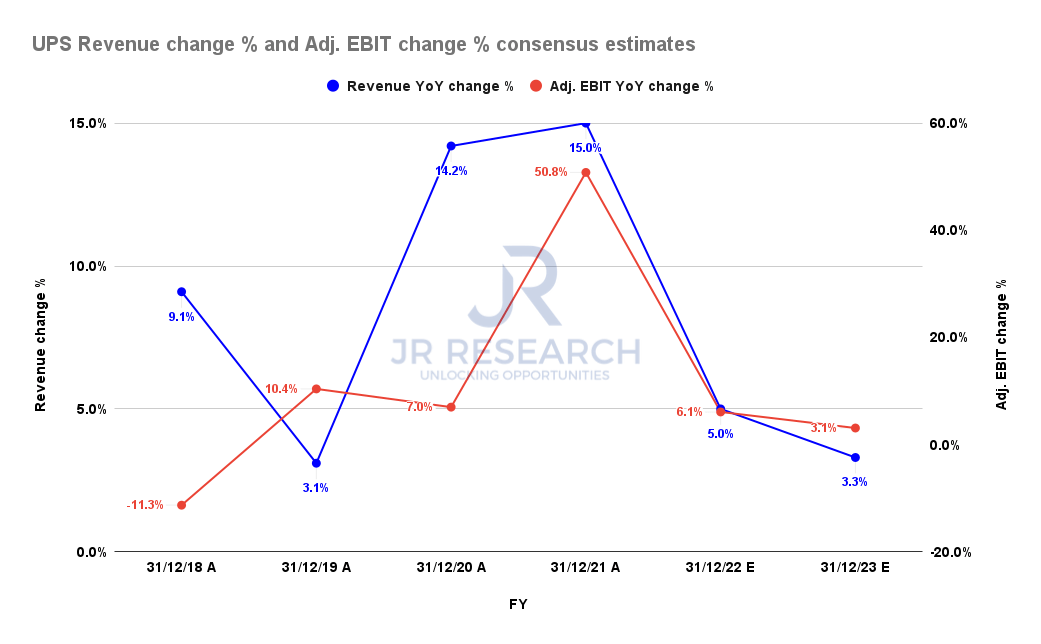
UPS revenue change % and adjusted EBIT change % consensus estimates (S&P Cap IQ)
After two years of above-average growth, the consensus estimates (generally bullish) suggest that its revenue growth is projected to normalize through FY23. UPS is estimated to post revenue growth of 5% in FY22, down from FY21’s 15%.
Moreover, it’s expected to impact its adjusted EBIT growth, as seen above. Consequently, we believe the weakness in UPS stock is reflective of the market revising its forward expectations of UPS stock, given its rapid surge since its COVID bottom.
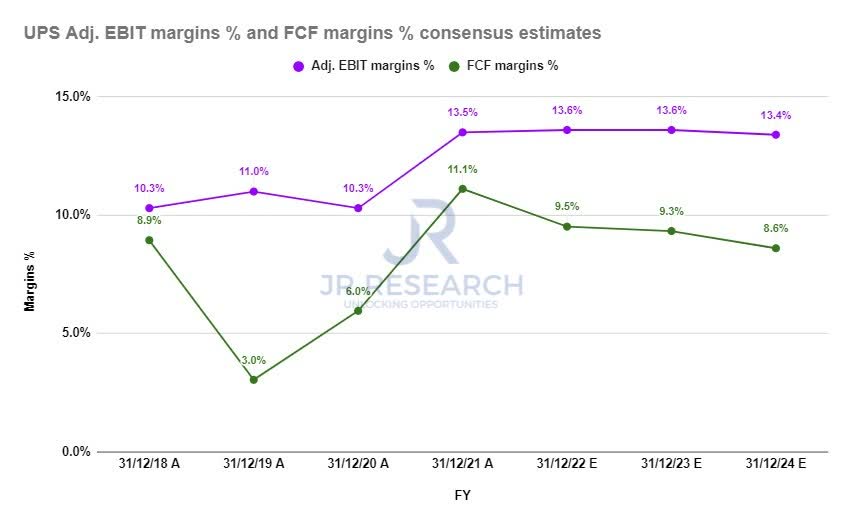
UPS adjusted EBIT margins % and FCF margins % consensus estimates (S&P Cap IQ)
Notwithstanding, its profitability is still expected to remain robust, which helps to undergird its valuation. UPS’s adjusted EBIT margins and free cash flow margins are estimated to remain above its pre-COVID metrics. It’s also expected to remain well above its five-year and 10-year average.
Therefore, UPS should be able to navigate the worsening macro headwinds with aplomb, lending credence to the resilience of its business model.
UPS – Beware Of Its Double Top Bull Trap
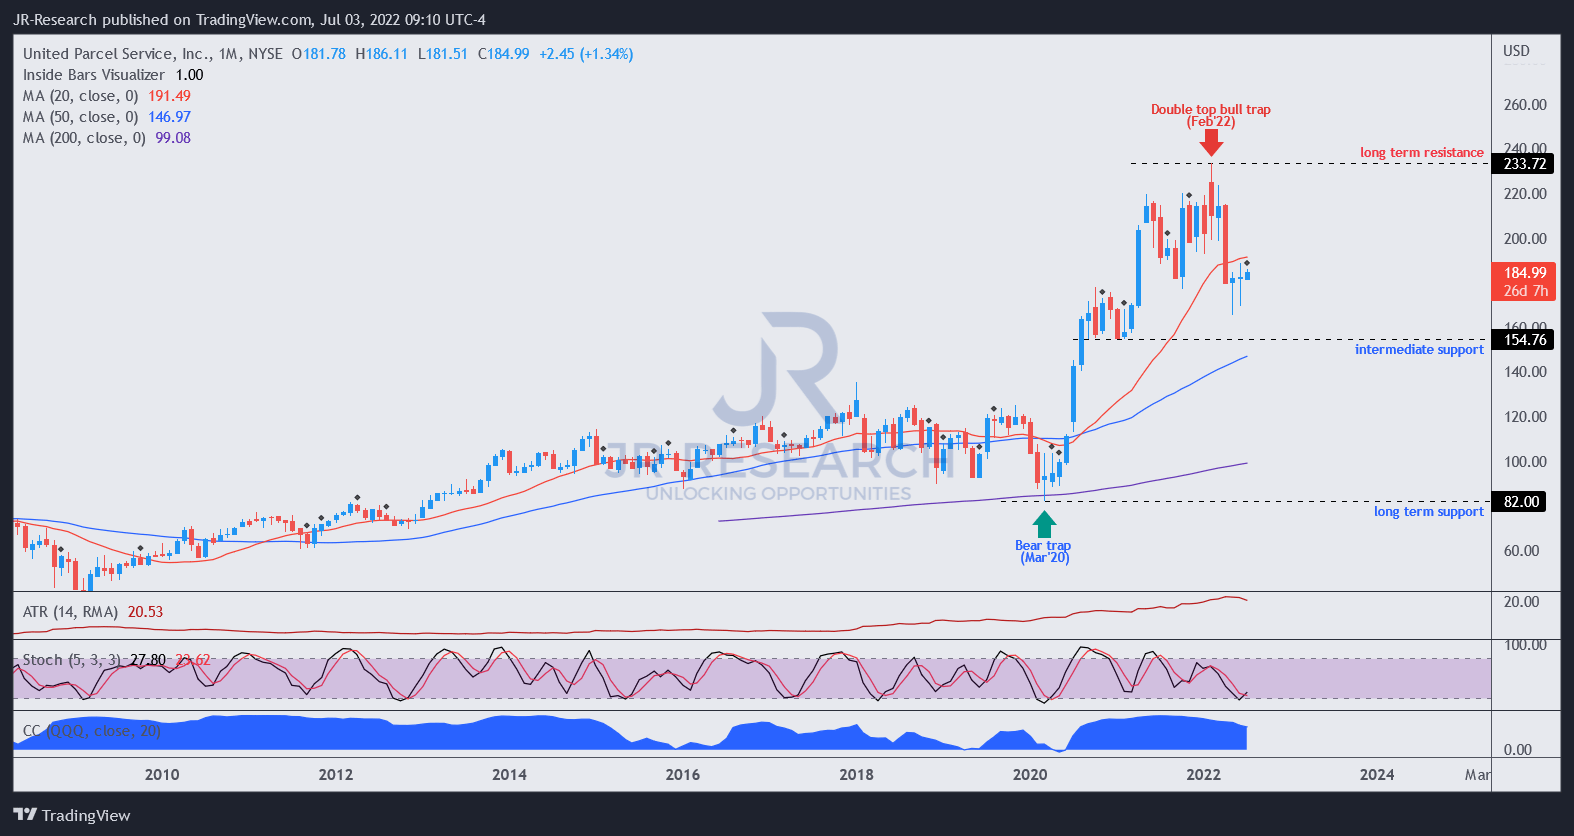
UPS price chart (monthly) (TradingView)
UPS already had a series of significant flush-up price action from 2020-21, leading to its double top bull trap in February 2022. The “knee-jerk” momentum build-up indicates buyers were drawn in rapidly. However, such build-ups are usually unsustainable, although they could take a while before forming a bull trap.
Notably, the double top bull trap formed in February after a distribution phase of close to nine months. Therefore it indicated that the market was ready to force a steep sell-off, as seen over the past few months.
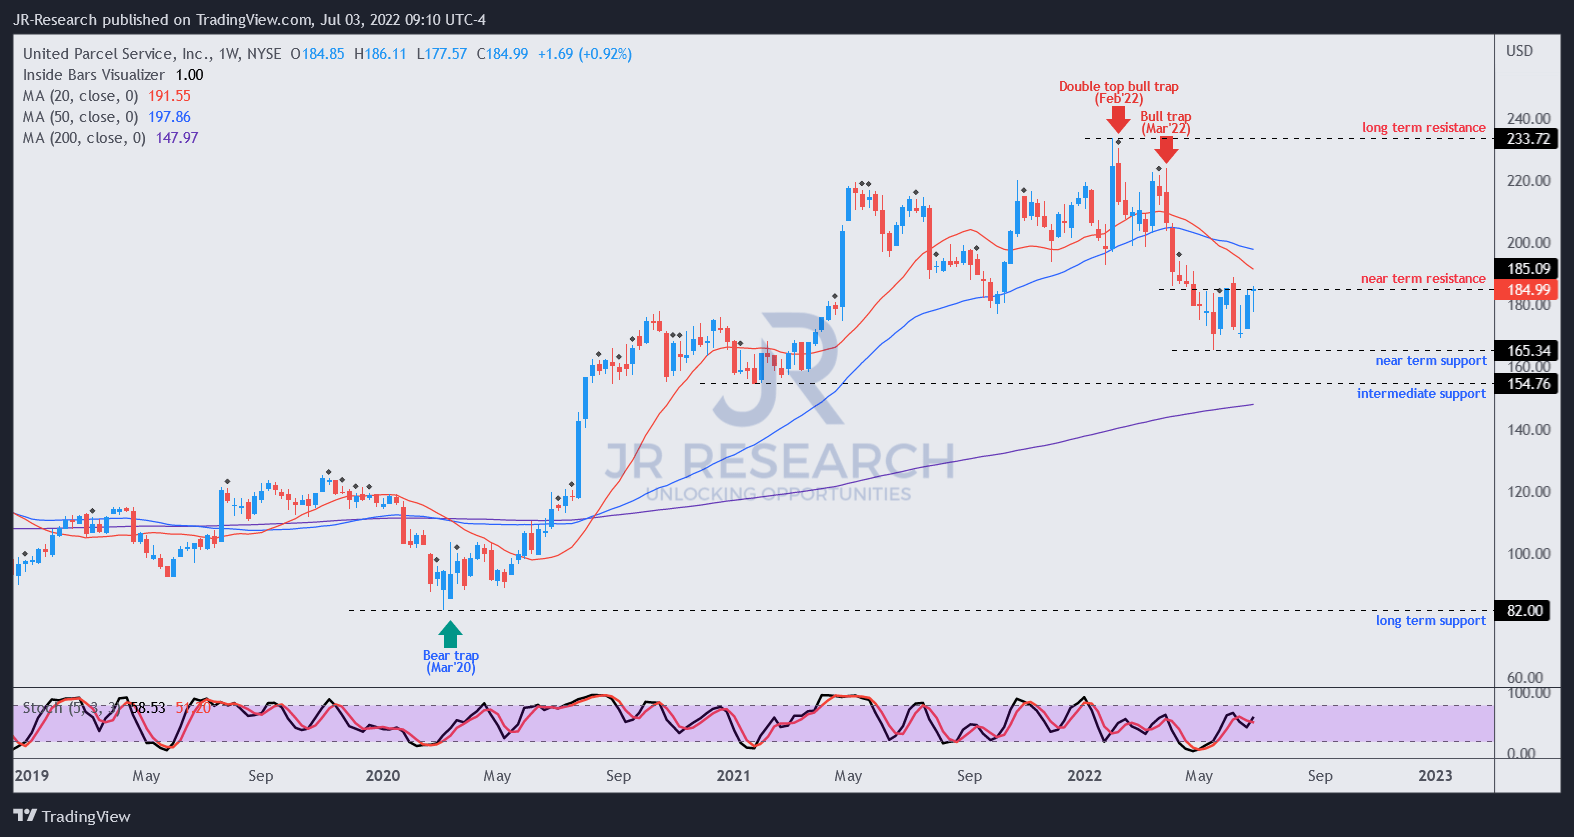
UPS price chart (weekly) (TradingView)
However, UPS is likely at a near-term bottom, consolidating since May. But the selling pressure at its near-term resistance has kept UPS mired in a dominant bearish bias. Therefore, we believe it could be another astute distribution phase by the market.
Notably, UPS has already lost its bullish momentum since April 2022. Also, it has been attempting to regain its bullish bias had been resolutely rejected.
We posit that it could be forced lower subsequently by another potential bull trap that could form close to its near-term resistance. As such, we urge investors to watch its price action closely.
UPS Could Underperform Significantly
UPS has been a remarkable winner for its investors over the past five years. It registered a 5Y CAGR of 10.8% and a 5Y total return CAGR of 14.24% (adjusted for dividends).
However, our valuation model suggests that UPS’ slowing revenue and profitability growth is setting up for potential underperformance despite having robust margins.
| Stock | UPS |
| Current market cap | $161.64B |
| Hurdle rate – CAGR | 11% |
| Projection through | CQ4’26 |
| Required FCF yield in CQ4’26 | 4.8% |
| Assumed TTM FCF margin in CQ4’26 | 8% |
| Implied TTM revenue by CQ4’26 | $155.11B |
UPS reverse cash flow valuation model. Data source: S&P Cap IQ, author
We applied a hurdle rate of 11% in our model, equivalent to its 5Y CAGR. We also used the 5Y mean of its FCF yield of 4.8% and a blended TTM FCF margin of 8%.
Consequently, we require UPS to post a TTM revenue of $155.11B by CQ4’26, which is unlikely, according to the consensus estimates.
UPS last traded at an FCF yield of 8.9%. Therefore, it’s well above its 5Y average. The market also set up its double top bull trap at a 5% yield. It also applied considerable selling pressure at its near-term resistance at yields of about 9%. We believe investors need to ask why the market has been asking for yields markedly higher than its 5Y average.
Therefore, we believe the market expects UPS to underperform its 5Y CAGR significantly moving forward, requiring higher FCF yields to compensate for a much lower implied hurdle rate.
Is UPS Stock A Buy, Sell, Or Hold?
We rate UPS a Sell.
UPS is likely at the second normalization phase after its massive gains from 2020-21. The double top bull trap sent UPS into its bearish bias as it has struggled to regain upward momentum.
Our valuation model indicates that UPS could significantly underperform if investors add at the current levels. Therefore, we urge investors to be patient and add this stock at levels much lower to improve the potential for outperformance.