The NASDAQ Nears An Inflection Point
wildpixel/iStock via Getty Images
In this latest episode of market volatility, dire news of interest rate hikes, ballooning mortgage costs, and inflation-everywhere-you-look has suddenly vanished.
The new reality is that inflation may have indeed been transitory.
The Bureau of Economic analysis confirms that the economy shrank -1.6% in Q1’2022 after rising 6.9% in Q4’2021, and will likely fall another -2.1% in Q2’2022, marking the beginning of a recession (2 consecutive quarters of economic retraction).
In a stock market grappling with disturbing uncertainty, things have quickly changed! The inflation drumbeat brings to mind the famous stock market quote of Mark Twain:
It ain’t what you don’t know that gets you into trouble. It’s what you know for sure that just ain’t so.”
At the beginning of the 2020 Pandemic, the Federal Reserve lowered interest rates to zero and ballooned their balance sheet to accommodate credit creation, including mortgage buyers. It flooded the market with so much liquidity that asset prices sky rocketed, and within 33 days the 2020 bear market had ended.
But in Q1’2022, the Fed announced it would reduce liquidity faster than they had produced it, throwing the stock market into one of most pessimistic moods in market history: the worst Q1 for the markets in 90 years, the worst first half in 50 years.
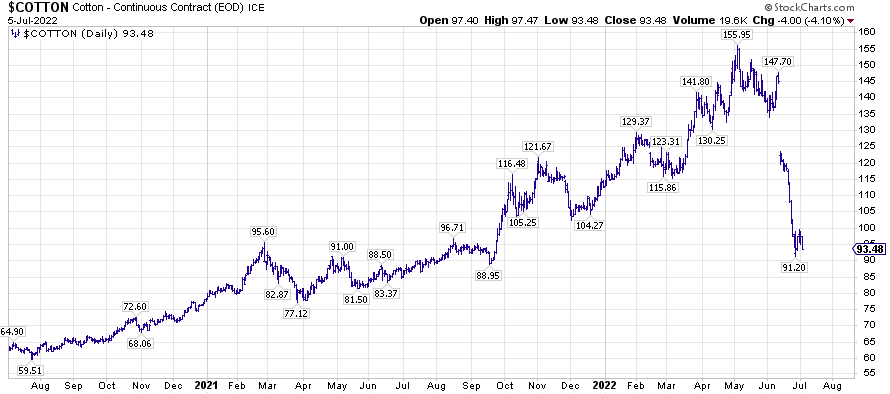
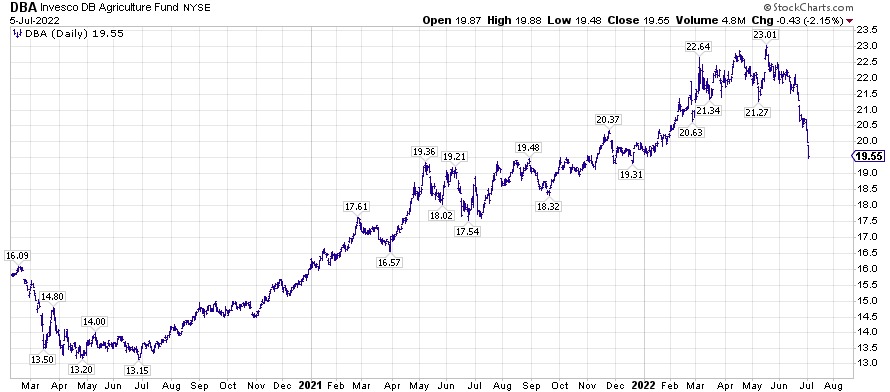
Rapidly Receding Commodity Prices
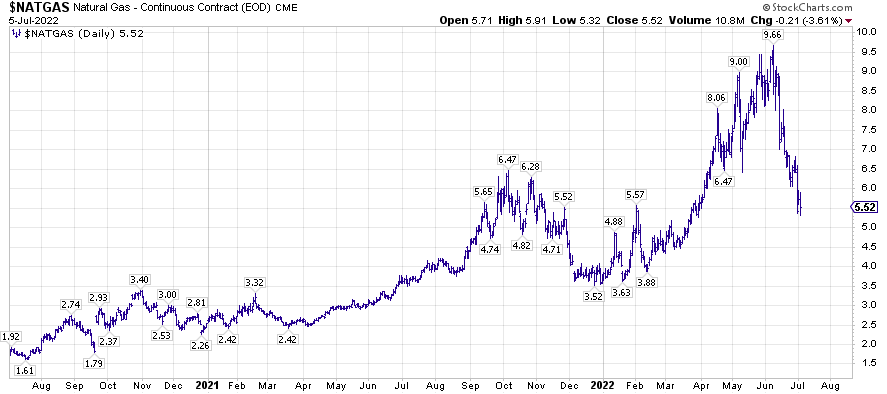
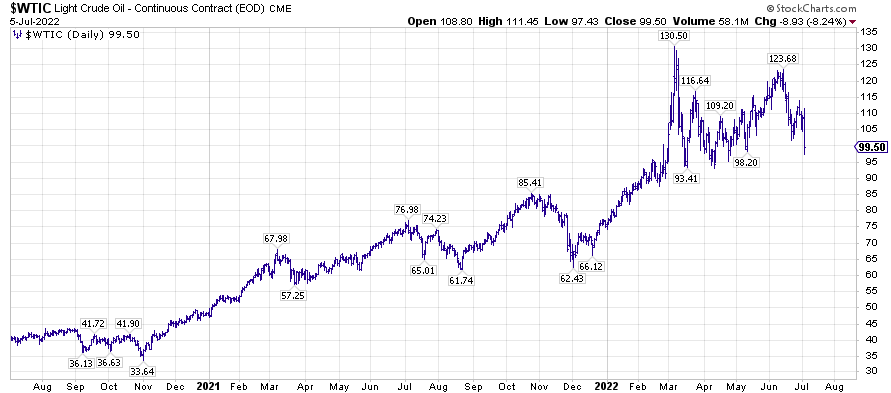
Copper is now down -32% from its March highs. Natural Gas is down -43% from highs reached just 3 weeks ago. Oil is down -20%, Cotton is down -42%, and agricultural products are down -15% from their May highs, ending a 2.5 year rise in prices. These are large percentage drops for commodities.
Stockcharts.com Stockcharts.com Stockcharts.com Stockcharts.com Stockcharts.com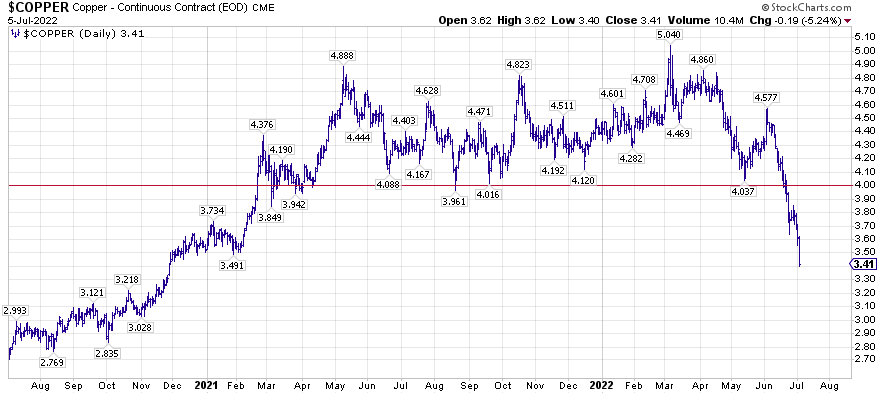
Interest Rate ratio to Copper and Gold
The ratio of interest rates to gold and copper, a good measure of economic activity, has now fallen -34% at a rate consistent with previous economic retractions. This turnaround in interest rates has been breath-taking, partially-erasing the parabolic rise of the previous 12 weeks. See chart below.
Stockcharts.com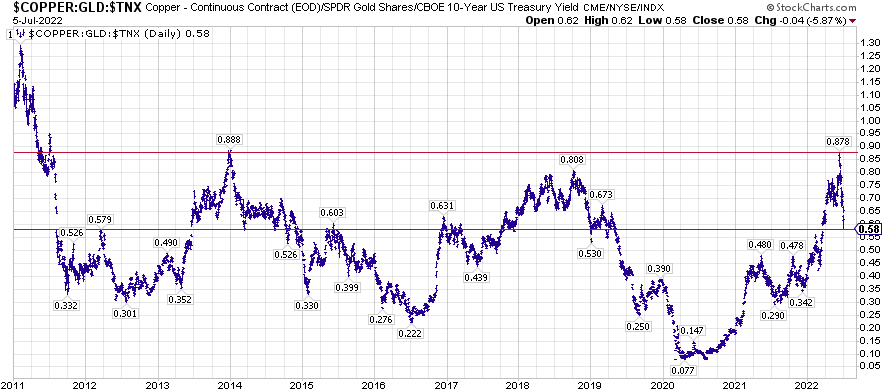
Based on this new information, a nascent rally in the bond market has begun. In the chart below, note the highs of the bond market in Q1’2021. These highs were congruent with the highs on the Nasdaq composite at that time (especially small caps).
Stockcharts.com Stockcharts.com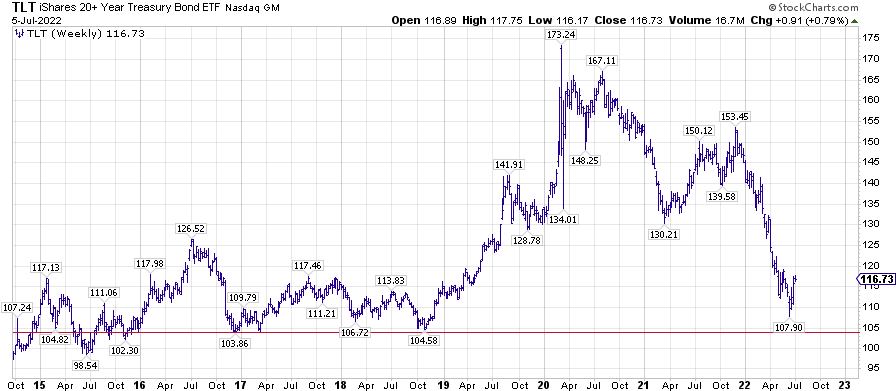
An 18 month bear market in the Nasdaq composite actually began in April, 2021, and has mirrored the bear market in the bond market, clearly showing the relationship between interest rates and tech stocks.
For further explanation of this relationship, see Bill Gunderson’s excellent article: Here’s why the Nasdaq Continues to Unravel, February 8, 2022.
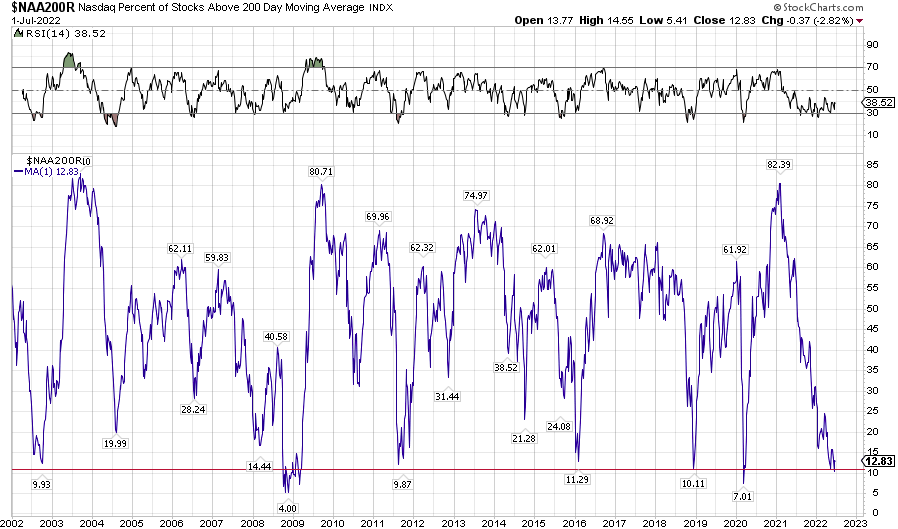
A second interesting point on the Nasdaq Composite chart is that hundreds of its components – mostly small caps – had already fallen below their 200 day moving averages months before the large caps collapsed in Q1’2022.
The percent of Composite stocks above their 200 day moving average had fallen from 82.39% to 30% by January 1, 2022, with very little downward action (yet) in the large caps on the exchanges.
One of the purposes of this article is to alert readers to this change in market environment: from rising rates and rising commodity prices to falling interest rates and falling commodity prices; from inflation to deflationary forces.
I think it is no coincidence that the peak of interest rates at 3.483% on June 14, 2022, was closely-aligned with the low in the Nasdaq Composite at 4% two days later.
NASDAQ 100
Stockcharts.com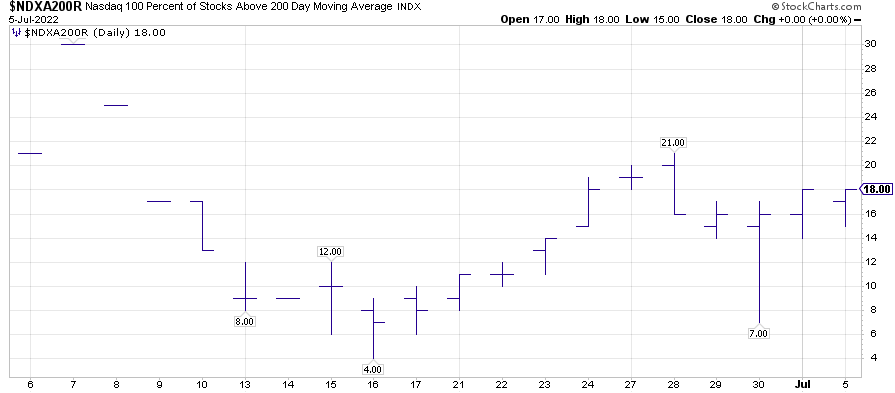
There has been only ONE time in the last 20 years when the Nasdaq composite was this oversold: the Great Financial Crisis (see chart below).
Stockcharts.com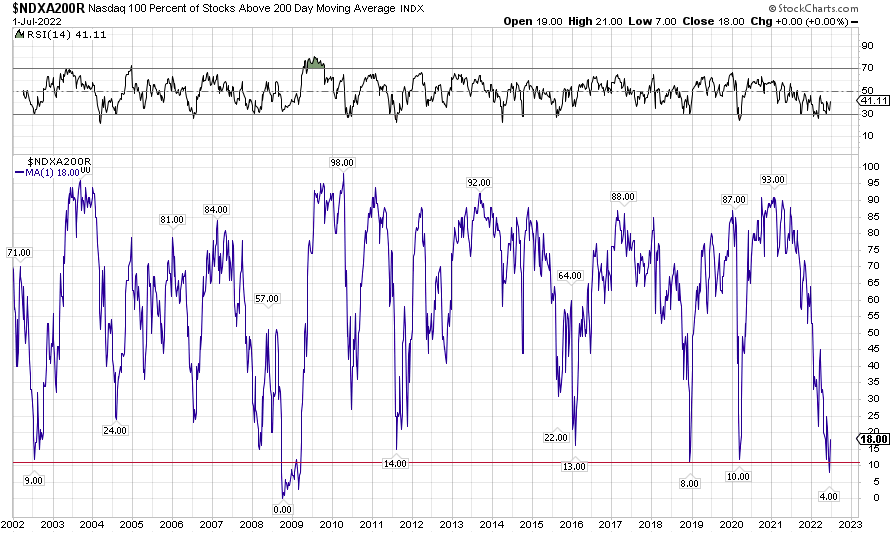
This low comes after a time of great pessimism in consumer sentiment. Regardless of the eventual outcome, the time has arrived when investors could consider re-allocating a portion of the Nasdaq back into their portfolio. The chart history of the Nasdaq is supportive of this investment.
JP Morgan Asset Mgmt – Univ of Michigan, Consumer Sentiment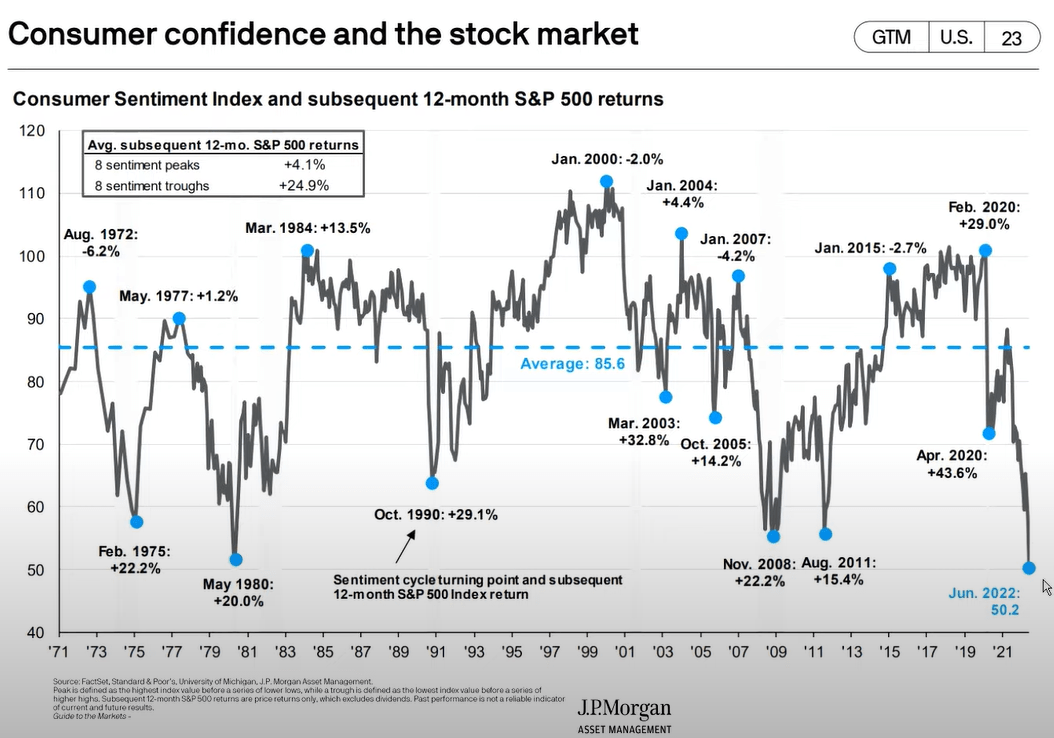
And if so moved, an equal allocation to the SPX 500. The overbought nature of the Nasdaq relative to the SPX 500 in 2020-21 has been alleviated, as the two indices have returned to their long-term trend line (2006-2022).
Stockcharts.com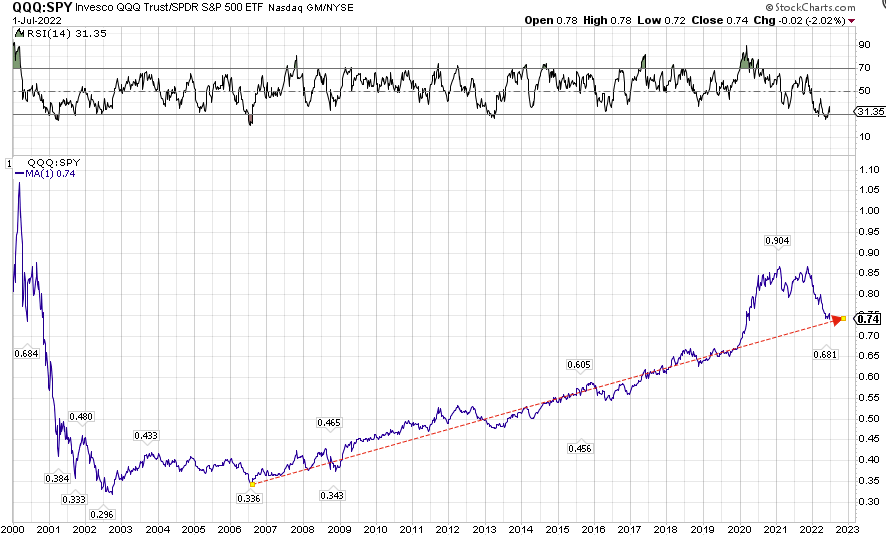
Investor Takeaway
Small cap Nasdaq stocks have outperformed since the June 16th low.
A close analog would be Schwab’s US Small Cap Fund (SCHA), or the SPDR portfolio Small Cap 600 fund (SPSM).
The SPX 600, Russell 2000, and Midcap 400 are also available in varying degrees of leverage
Lastly, there is the Nasdaq 100 itself, considered the bastion of tech stocks in the US.
- Nasdaq 100 ETFs: QQQ (1x), or QLD (2x), or TQQQ (3x)
- Technology Stocks: (XLK) (1x), (ROM) (2x), (TECL) (3x)
Investing at turning-points in the market is not for the faint of heart. There have been so many whipsaws as we sank to this point. But during the previous trading week, 90-96% percent of stocks in the Nasdaq Composite and NDX100 were trading at 2 standard deviations below the mean of their 200 day moving averages, an extremely oversold condition, and worth a look.