Tesla Q3: Keeping Pace With Wright’s Law (NASDAQ:TSLA)
Xiaolu Chu
Q3 delivery data and thesis
In its Q3 2022 press release, Tesla (NASDAQ:TSLA) reported a total delivery of over 343,000 cars worldwide. Its Model 3/Y continues to dominate the deliveries, with production totaling 345,988 and delivery totaling 325,158 (about 95% of all cars delivered in Q3). In the past, its delivery volumes tended to be uneven and skewed towards the end of each quarter due to regional batch building. And management seems to have found a way to break this bottleneck, paving the way for further production volume ramp-up. A description of this method is quoted below and is slightly edited with emphasis added by me:
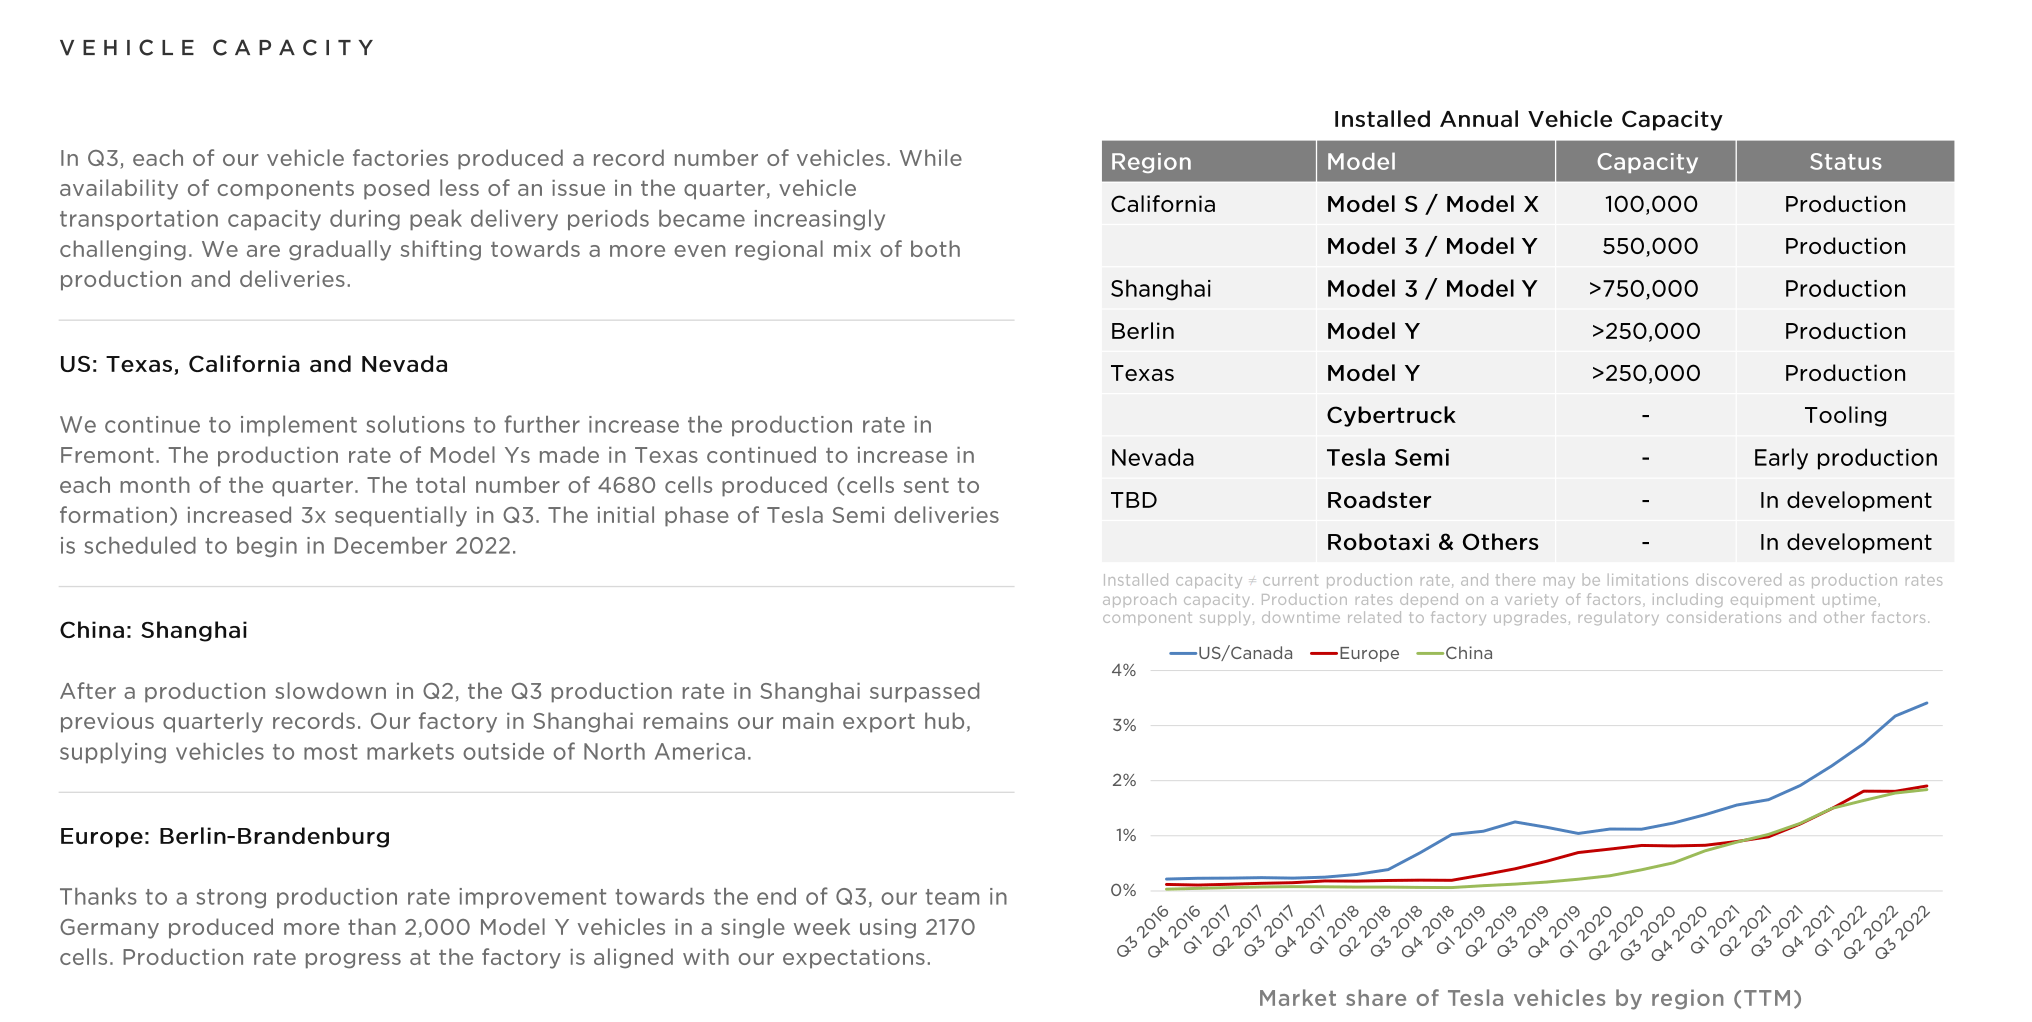
As our volume keeps growing, it is becoming increasingly challenging to secure vehicle transportation capacity and at a reasonable cost during these peak logistics weeks (i.e., towards the end of each quarter). In Q3, we began transitioning to a more even regional mix of vehicle builds each week, which led to an increase in cars in transit at the end of the quarter. These cars have been ordered and will be delivered to customers upon arrival at their destination.
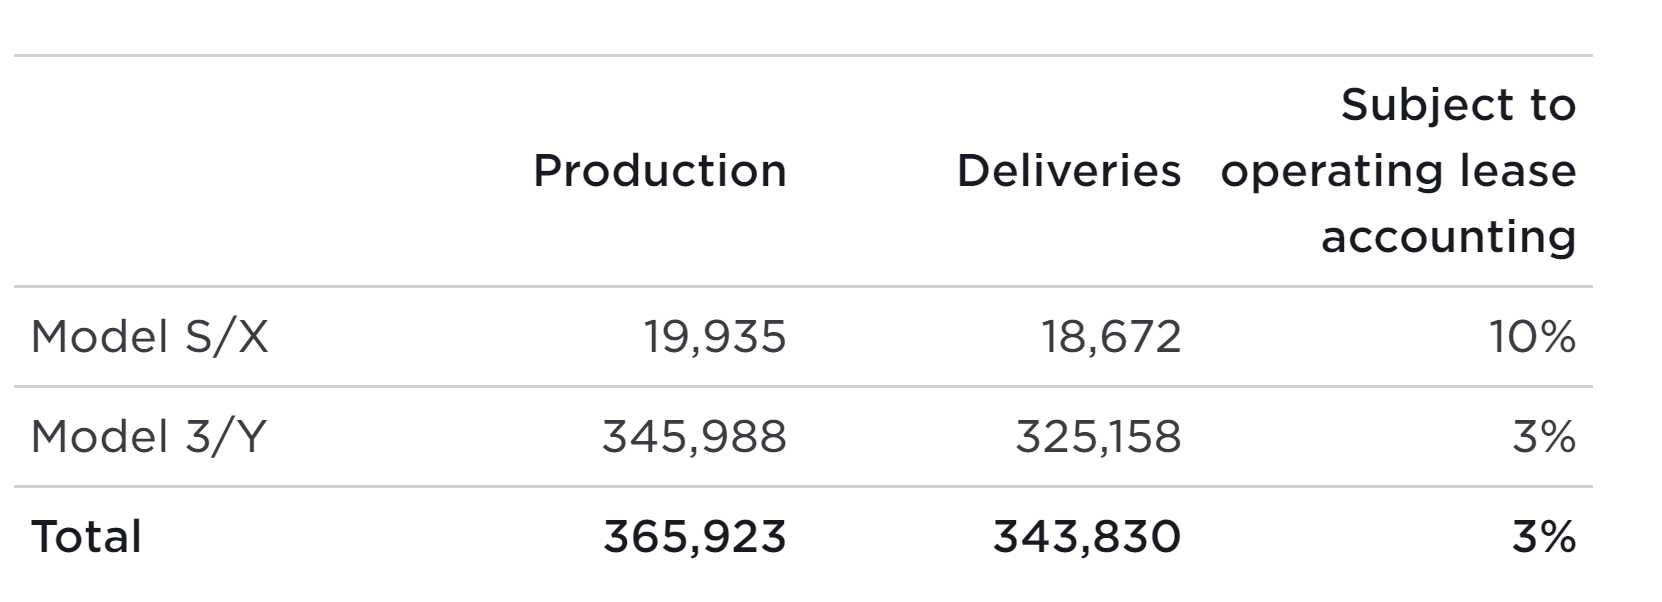
Source: TSLA Q3 press release
Besides this logistical and production innovation, I also see a few other key catalysts to further boost its scalability in the near future, as to be elaborated on later. But in my mind, the most fundamentally important aspect for a manufacturing business like TSLA is the ability to drive down its costs as production ramps up – captured in Wright’s law as described next.
Wright’s law
Simpler put, Wright’s law is an observation made for the aircraft business but later found to be widely applicable to an amazing spectrum of other businesses such as silicon chips and automobile manufacturing. The observation is that for every doubling of cumulative units produced, the labor cost per unit would decrease by 10-15%. The chart below is taken from ARK Invest, showing how the law applied to the auto industry (i.e., the traditional auto industry).
Specific to the auto industry, the following chart shows a fitting of Ford’s Model T production data between 1909-1923 to Wright’s Law. As seen, the data is precisely predicted by Wright’s Law, which says the relationship should be a straight line on a double logarithm scale. And if you measure the slope of this line in the chart, you will see that it is about 15%. This means that the traditional auto industry has enjoyed a 15% cost reduction per cumulative production doubling, i.e., the upper bound of Wright’s law.
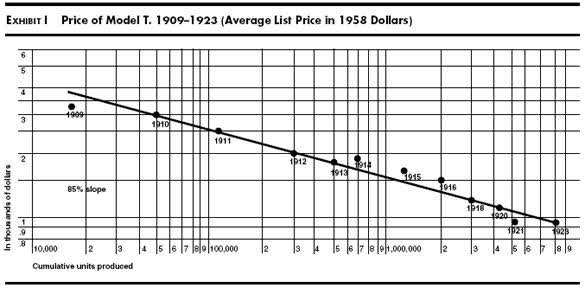
Source: ARK invest
TSLA Q3 data kept pace with the law
Now, let’s see if TSLA’s data so far fit this law or not. The next figure shows a fitting of TSLA’s delivery data so far according to Wright’s Law. The chart is quite crowded with quite dense information contents. So, let me point out a few key points up front. First, the vertical axis displays its TSLA’s cumulative average unit cost, which was calculated by dividing its total cost of revenue by the cumulative total of vehicles sold (that is since 2013 when it sold its first batch of vehicles). Second, the horizontal axis shows the cumulative number of vehicles sold (again since 2013). And finally, the plot is made in a double logarithm scale. This way, if the data fit the law, you would see a declining line (like the above plot in the case of Ford’s Model T).
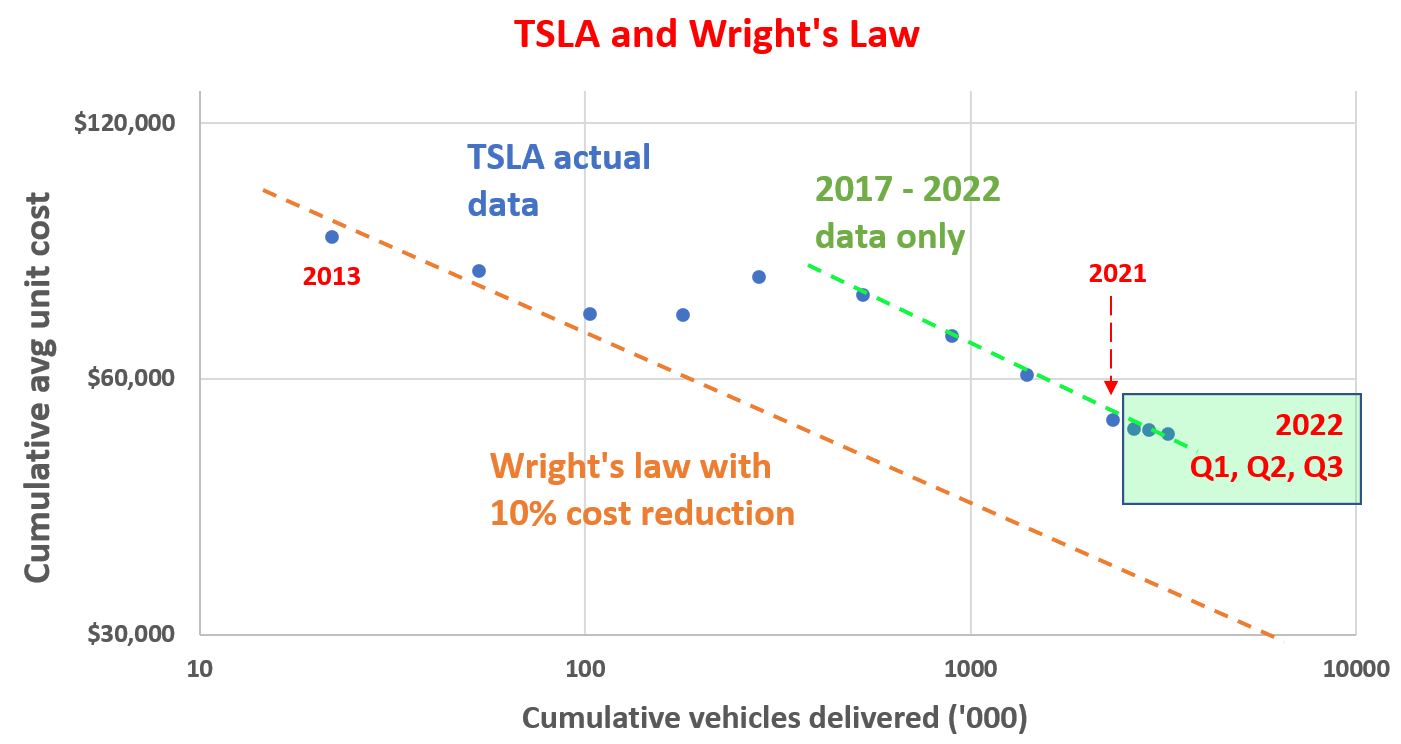
Source: author based on Seeking Alpha data
With the above background, the first thing you noticed here is that TSLA’s data do not fit as neatly as Ford’s (at least not thus far yet). But the general trend is declining, which is good news to start. nice place to start. The reason why it is not an ideal and neat fit is that TSLA is still in its early stage. The major changes in its models and production methods can cause a large deviation in the fitting. For example, the addition of each giga-factory could impact the slope of the fitting.
However, if we group the data points and perform segmented fitting, as shown in the figure above, you can see each data group fits into the law pretty nicely. To wit, the orange line displays the fitting in its earlier years between 2103 and 2015. And the green dashed line shows the fitting of the data since 2017 when its production and delivery scale is much larger. The green dashed line show is a line with a slope that corresponds to a 10% unit cost reduction per production doubling.
Next, let me draw your attention to the 2022 Q3 data point (the last data point in the green box). As seen, its Q3 data is on the fitted line, showing that its cost reduction kept pace with Wright’s Law of a 10% slope. To wit, it has delivered a cumulative total of 3.247M vehicles as of Q3 and incurred a cumulative cost of revenue of $167.7B since 2013. As a result, its cumulative average unit cost is $51,648 per vehicle delivered as of Q3. To put things into perspective, the average unit cost up to 2021 was $53,720. Hence, its Q3 2022’s unit cost is about 4% below the figure in 2021.
In my mind, this is a fundamental signal verifying TSLA’s lead – both its technological lead and logistical lead. It was able to keep marching in pace with Wright’s Law despite the challenges it has suffered in the past year, ranging from COVID-related shutdowns, record shipping costs, record raw material costs, et al. As the raw material cost and inflation gradually ease, I am optimistic that TSLA could further push down its unit costs and profitability.
Risks and final thoughts
Looking forward, there are some headwinds on the horizon. There could be some inefficiencies and speedbumps along the way as it keeps ramping up its production at new factories (especially those factories involved in the tooling and early production of new models like the Semi and Cybertruck). The supply-chain bottlenecks that continue to plague the industry could persist longer. And its China factories could face lockdown again in the case of a COVID resurgence in the country. For example, its Shanghai factory suffered slowdowns in Q2 due to extended suspension caused by COVID. Furthermore, Shanghai is also a key port city and is TSLA’s main export hub to deliver vehicles to its ex-U.S. markets. Finally, there is a possibility for a global recession in the near future.
Source: TSLA Q3 ER
All told, TSLA’s production and delivery results are keeping pace with Wright’s Law in Q3 2022. In my mind, it is a strong testament to the resilience of TSLA’s model. Its vertical integration was tested during challenging times in the past 1~2 years by global supply chain disruptions, record raw materials cost, and COVID interruptions. Yet, its unit production cost kept pace with Wright’s Law and declined at a 10% slope. Its cumulative average unit cost decreased by 4% to $51,648 per vehicle delivered as of Q3 2022 from its 2021 level. Looking forward, I see several catalysts to further pushing down its unit costs and enhancing its profitability.