Starbucks Has Weathered 2022, Valuation Is A Challenge (SBUX)
Scott Olson
Starbucks (NASDAQ:SBUX) has gained about 15% in the past 3 months and the shares are 41% above the 12-month low closing price of $69.9 on May 12th. For 2022 as a whole, the return picture is mixed. SBUX has returned -13% so far in 2022, as compared to -7.5% for the restaurant industry as a whole (as tracked by Morningstar) and -18% for the S&P 500 (SPY).
Seeking Alpha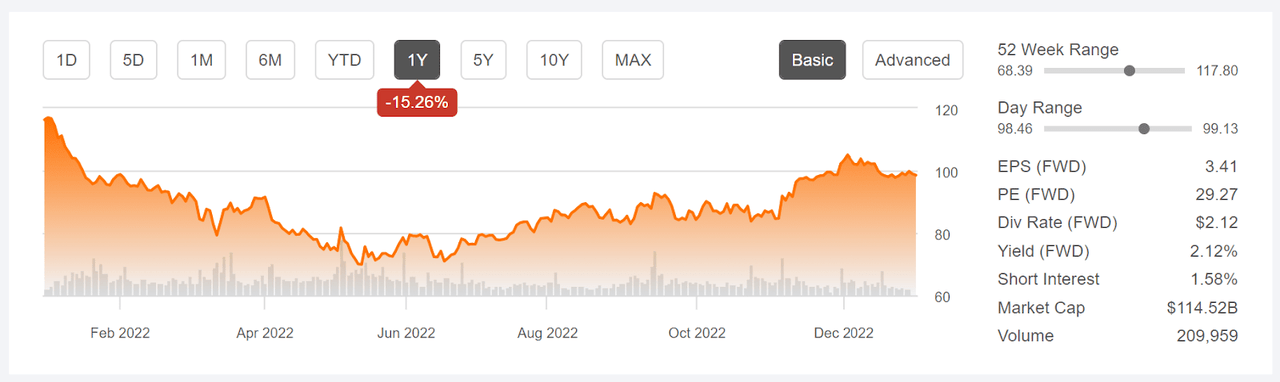
12-Month price history and basic statistics for SBUX (Source: Seeking Alpha)
Starbucks has faced significant labor issues in 2022, with management coming up against growing unionization efforts by employees. The first store unionized in late 2021 and more than 250 stores have unionized since then. Outgoing CEO Howard Schultz has broadly opposed unionization by SBUX workers. With SBUX’s significant presence in China, the country’s progress in dealing with the rapid spread of COVID could materially impact Starbucks performance, as CEO Howard Schultz noted in the Q4 earnings call.
Earnings have been solid in recent quarters. While Q3 and Q4 of FY 2022 beat expectations, quarterly EPS was well below the 2021 results for Q3 and Q4. The expected earnings for Q1 of FY 2023 (to be reported on February 2, 2023) are slightly above the Q1 results from 2022 but below the value for Q1 of 2020. The longer-term view is quite favorable, with a consensus expectation of EPS growth of 15% per year over the next 3 to 5 years.
ETrade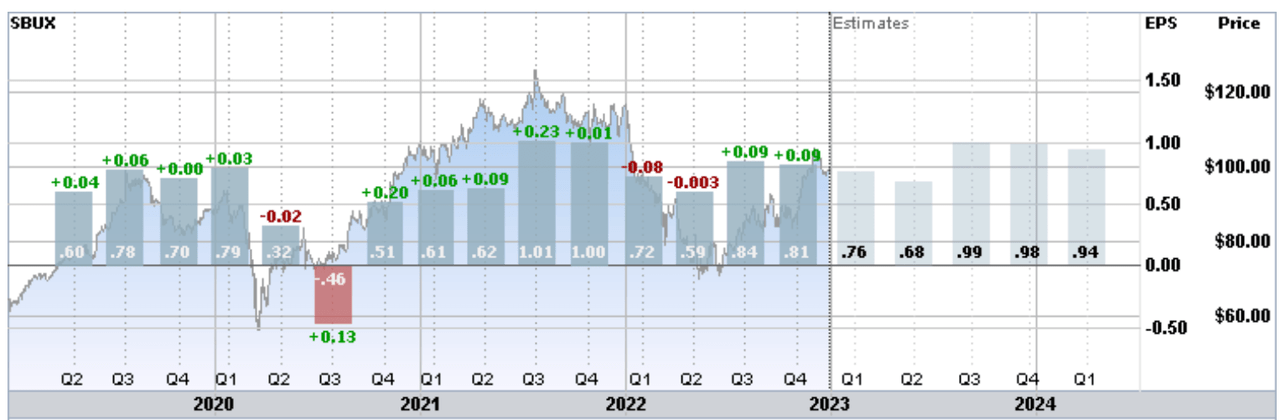
Trailing (4 years) and estimated future quarterly EPS for SBUX. Green (red) values are amounts by which EPS beat (missed) the consensus expected value (Source: ETrade)
The share valuation continues to be a concern, with the forward P/E at 29.3. This is not an especially high value, as compared to the past 5 years, but necessitates substantial growth to support this share price. Seeking Alpha’s valuation grade for SBUX is an F.
I last wrote about SBUX on January 25, 2022, at which time the shares were trading at $96.93 and I maintained a buy rating. From the market close on January 25th, SBUX has returned a total of +4.1% (including dividends) vs. -11.3% for the S&P 500 (SPY). At that time of this post, earnings had robustly recovered from the pandemic-driven lows of 2020, but the shares had plummeted almost 18% since the start of 2022. The Wall Street analyst consensus rating was bullish. With the selloff in January, the Wall Street consensus 12-month price target was 28% above the share price at that time. The market-implied outlook, a probabilistic price forecast that represents the consensus view from the options market, was slightly bullish to the middle of 2022 and for the full year, with expected volatility of 33% (annualized). As a rule of thumb for a buy rating, I want to see an expected 12-month return that is at least ½ the expected volatility. Taking the Wall Street consensus price target at face value (implying a total return of about 30%), SBUX far exceeded this threshold.
For readers who are unfamiliar with the market-implied outlook, a brief explanation is needed. The price of an option on a stock reflects the market’s consensus estimate of the probability that the stock price will rise above (call option) or fall below (put option) a specific level (the option strike price) between now and when the option expires. By analyzing the prices of call and put options at a range of strike prices, all with the same expiration date, it is possible to calculate the probable price forecast that reconciles the options prices. This is the market-implied outlook. For a deeper discussion than is provided here and in the previous link, I recommend this outstanding monograph published by the CFA Institute.
I have calculated updated market-implied outlooks for SBUX and compared these with the current Wall Street consensus outlook in revisiting my rating.
Wall Street Consensus Outlook for SBUX
ETrade calculates the Wall Street consensus outlook for SBUX using price targets and ratings from 13 ranked analysts who have published opinions in the last 3 months. The consensus rating is a buy, as it has been for all of the past 12 months. The consensus 12-month price target is $99.83, 0.97% above the current share price, indicating that the expected growth over the next year is already priced in. The consensus price target as of January 25, 2022 was $124.70.
ETrade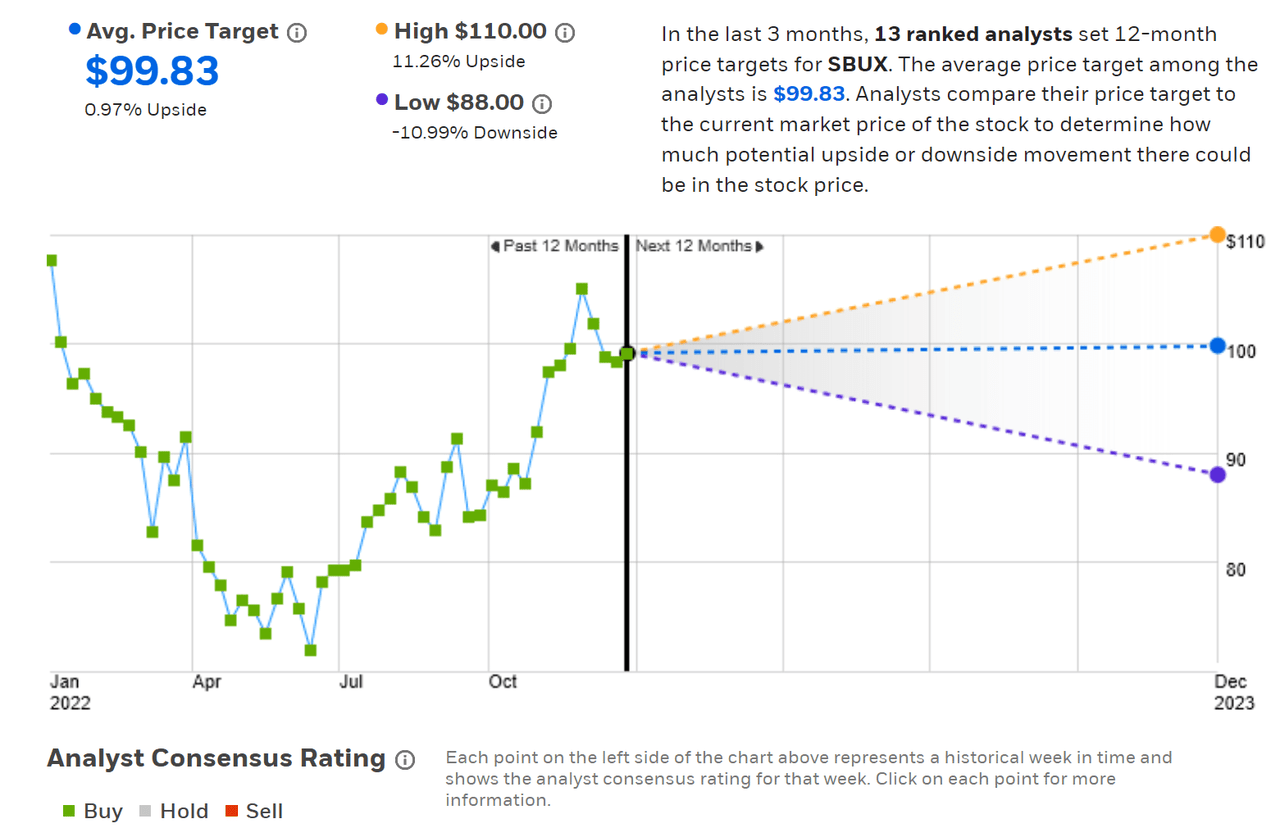
Wall Street analyst consensus rating and 12-month price target for SBUX (Source: ETrade)
Seeking Alpha’s version of the Wall Street consensus outlook for SBUX is calculated using the views of 34 analysts who have published price targets and ratings in the last 90 days. The consensus rating is a buy and the consensus 12-month price target is 2.3% above the current share price. The consensus 12-month price target was about $122 on January 25th, as compared to $100.86 today.
Seeking Alpha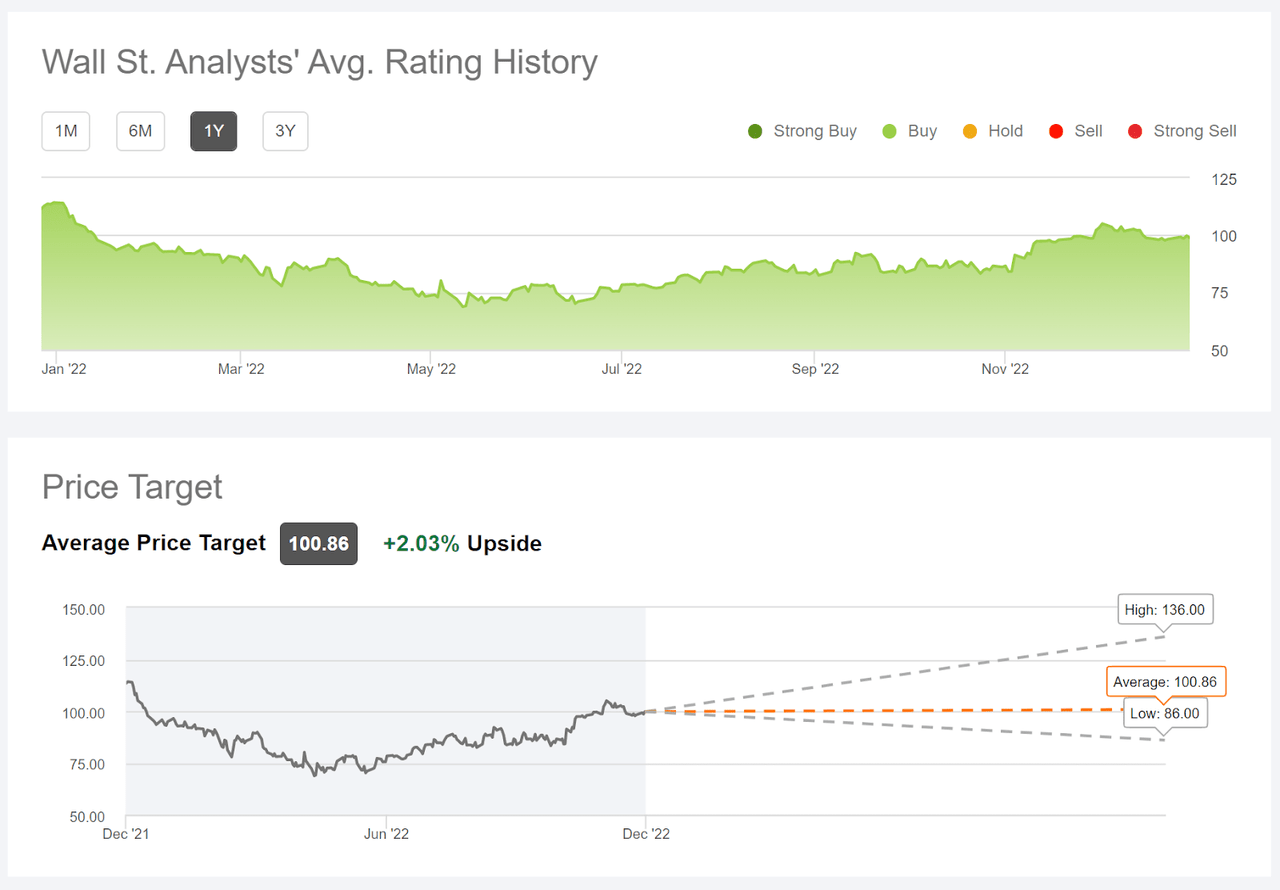
Wall Street analyst consensus rating and 12-month price target for SBUX (Source: Seeking Alpha)
The Wall Street consensus outlook for SBUX, as calculated by ETrade and Seeking Alpha, continues to be a buy, but the recent rally, combined with a substantial drop in the consensus 12-month price target, has brought the share price very close to the consensus 12-month price target.
Market-Implied Outlook for SBUX
I have calculated the market-implied outlook for SBUX for the 5.5-month period from now until June 16, 2023 and for the 12.6-month period from now until January 19, 2024, using the prices of put and call options that expire on these dates. I selected these two expiration dates to provide a view to the middle of 2023 and through the entire year.
The standard presentation of the market-implied outlook is a probability distribution of price return, with probability on the vertical axis and return on the horizontal.
Geoff Considine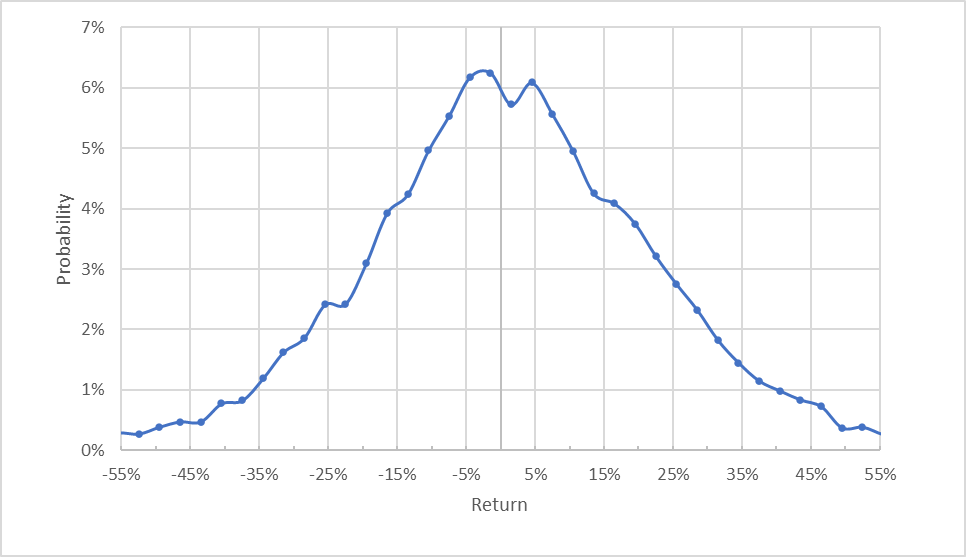
Market-implied price return probabilities for SBUX for the 5.5-month period from now until June 16, 2023 (Source: Author’s calculations using options quotes from ETrade)
The outlook to the middle of June is generally symmetric, with comparable probabilities of positive and negative returns of the same size. The expected volatility calculated from this distribution is 33.4%, close to the expected volatility that I calculated in January.
To make it easier to compare the relative probabilities of positive and negative returns, I rotate the negative return side of the distribution about the vertical axis (see chart below).
Geoff Considine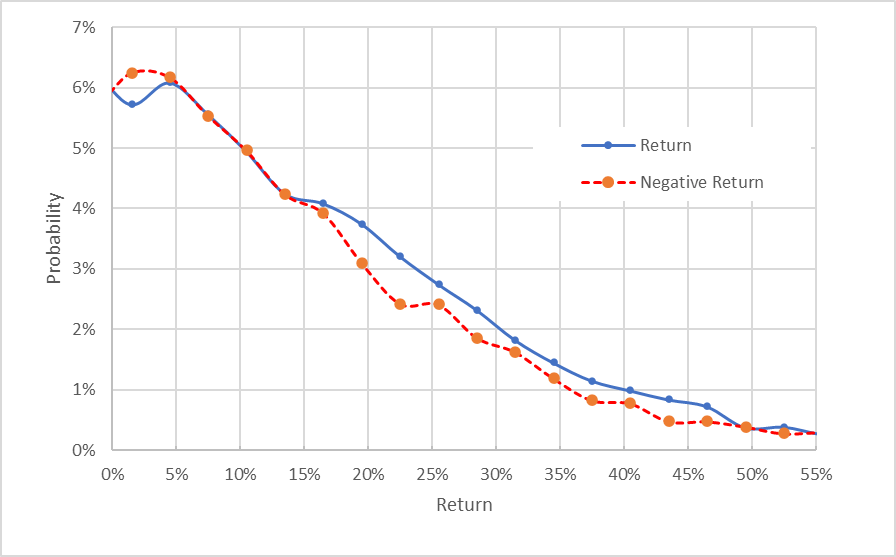
Market-implied price return probabilities for SBUX for the 5.5-month period from now until June 16, 2023. The negative return side of the distribution has been rotated about the vertical axis (Source: Author’s calculations using options quotes from ETrade)
This view shows that the probabilities of positive returns tend to be at, or slightly above, the probabilities of negative returns (the solid blue line is on or above the dashed red line over almost all of the chart above). This tilt suggests a slightly bullish view to the middle of 2023.
Theory indicates that the market-implied outlook is expected to have a negative bias because investors, in aggregate, are risk averse and thus tend to pay more than fair value for downside protection. There is no way to measure the magnitude of this bias, or whether it is even present, however. The expectation of a negative bias reinforces the interpretation of this outlook as slightly bullish.
The market-implied outlook for the 12.6-month period from now until January 19, 2024 exhibits an even closer match between the probabilities of positive and negative returns. The probabilities of larger-magnitude positive returns are consistently slightly higher than for same-magnitude negative returns (the solid blue line is on or above the dashed red line over the right ¾ of the chart below). Particularly considering the expected negative bias, this outlook is slightly bullish, although less than the view to the middle of 2023.The expected volatility calculated from this distribution is 32.6%.
Geoff Considine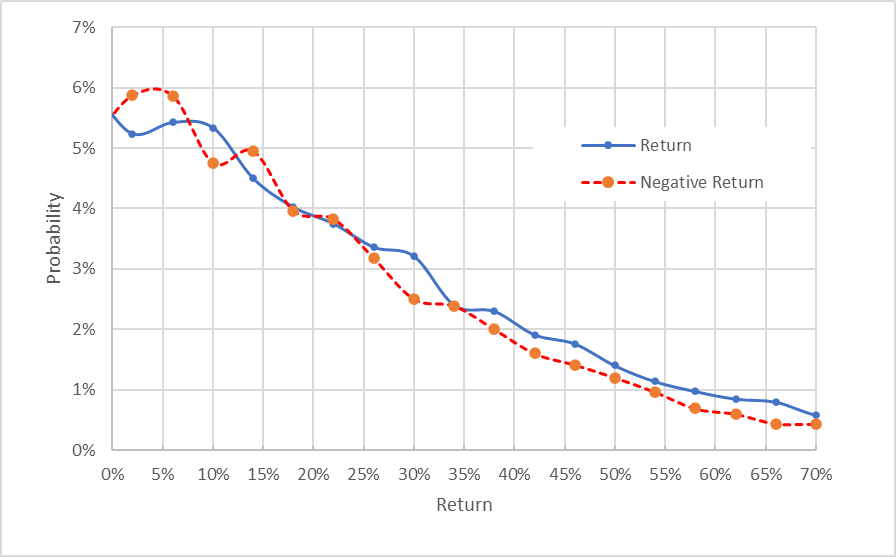
Market-implied price return probabilities for SBUX for the 12.6-month period from now until January 19, 2024. The negative return side of the distribution has been rotated about the vertical axis (Source: Author’s calculations using options quotes from ETrade)
The market-implied outlooks for SBUX to the middle of 2023 and into the start of 2024 are slightly bullish, with moderate volatility. They are slightly more bullish than the outlooks from my January analysis.
Summary
SBUX investors have had a good year relative to the broad market indexes, although the shares have lagged the restaurant industry. The valuation is fairly high. The company also faces challenges from the growing unionization of stores and the legal burden created by opposing this trend. The trajectory of COVID in China is likely to have a material impact on the company’s earnings in the coming quarters and how that will unfold is a large question mark. Starbucks has navigated the reopening of the U.S. economy and rising inflation well. The Wall Street consensus rating continues to be bullish. The rising share price and falling consensus price target have converged, suggesting that there is little expected upside for SBUX over the next 12 months. The market-implied outlook for SBUX is slightly bullish to the middle of 2023 and to the start of 2024, albeit less for the longer period. I am maintaining my buy rating on the shares for the time being, although the current valuation leaves little room for error.