SPDR S&P 500 Trust ETF (SPY): We’re Not Buying The Dip
Matteo Colombo
If you’re an experienced investor, you will probably align with the saying of, “buy low, sell high”. However, bear markets could be misleading as they tend to present an illusion that you’re buying low, but before you know it, you’re down by another multitude of basis points on your portfolio.
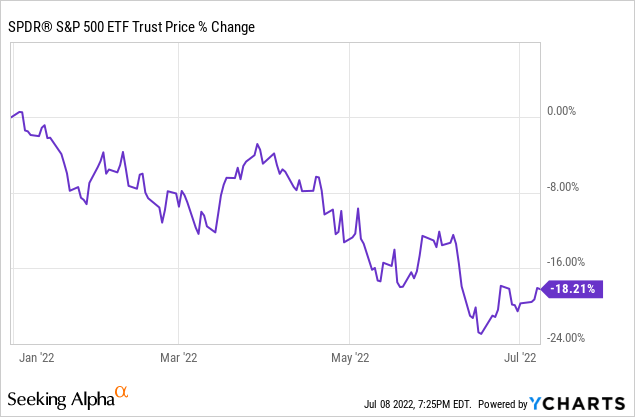
In an article last month, we covered the SPY (NYSEARCA:SPY) in which we opined that the S&P 500 and the SPY, which tracks the S&P 500, could be set for a downturn. We weren’t entirely correct with our analysis as the index and SPY have both traded flat. Nevertheless, we remain bearish on both for now; here’s why.
Re-Emphasizing Proximities
As in our previous article, I’d like to re-state the proximity between the SPY and the S&P 500 index as it’s critical to establish correlation before utilizing overlying data points.
As displayed in the figure below, the SPDR S&P 500 Trust ETF tracks the S&P 500 with an error of only 0.04% over a 1-year basis, 0.07% over a 3-year basis, and 0.06% over a 5-year basis. As such, considering the close proximity between the SPY and the S&P 500 index, it’s possible to analyze their long-term prospects as a collective.
Seeking Alpha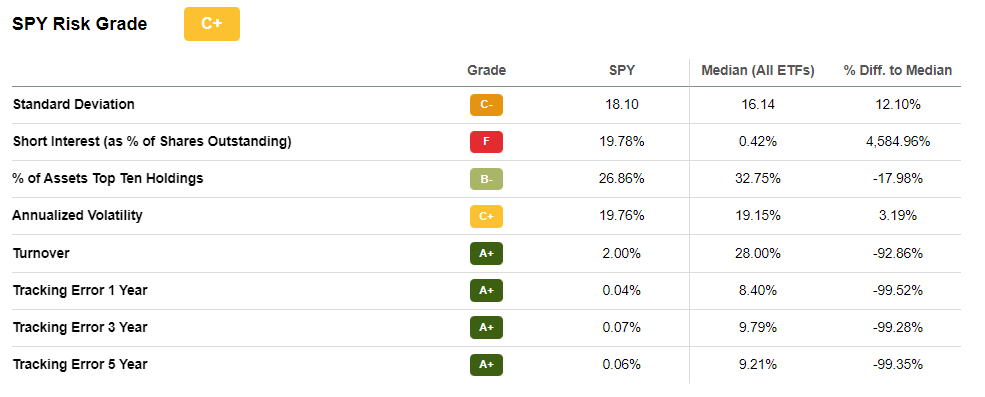
From a Statistical Vantage Point
Statistical metrics are valuable tools to utilize when seeking parsimonious conclusions.
The prominent metric to utilize is the Fed valuation model, which draws a valuation conclusion based on the S&P 500 earnings yield and the U.S. 10-year bond yield.
According to Yardeni Research, the U.S. 10-year yield remains below the earnings yield. Yet, it’s trivial to observe the trajectory of the two metrics. The trajectory implies that the bond yield is growing at a steeper rate than the earnings yield. Thus, divergence is likely, meaning that the index will soon be overvalued from a statistical vantage point.
Yardeni Research; Gurufocus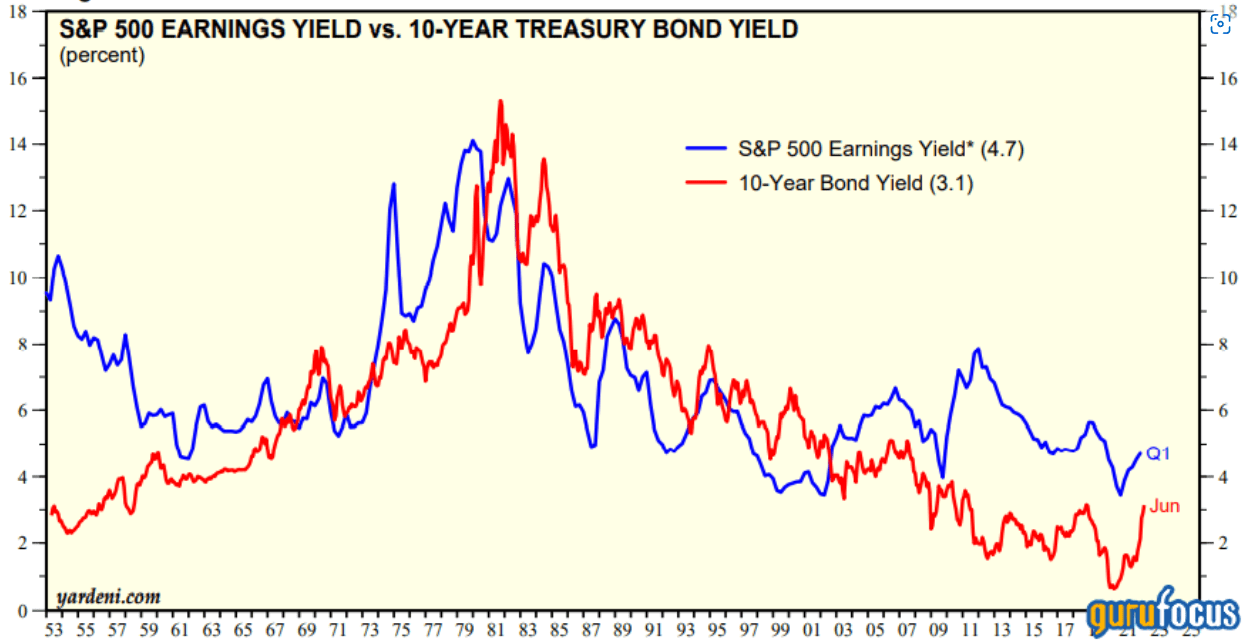
Additionally, the U.S. stock universes’ market capitalization is at an approximate 1.56x premium to the GDP, which is concerning if one considers that the chart below also displays that there’s an inverse correlation between market capitalization and GDP. Moreover, it’s clear that much of the index’s gains during the past twenty years were realized after the housing crisis (2007/08), in which economic stimulus paired with low inflation caused asset prices to inflate.
Gurufocus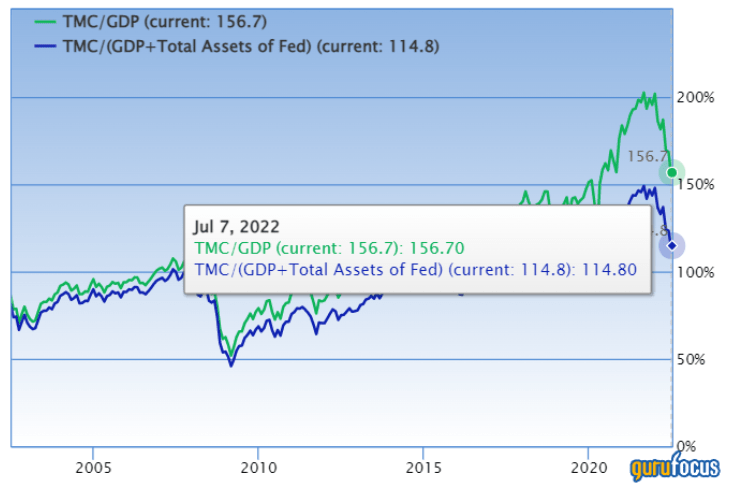
Economic Deconstruction
Let’s add more substance to the statistical observations by observing a few macroeconomic data points.
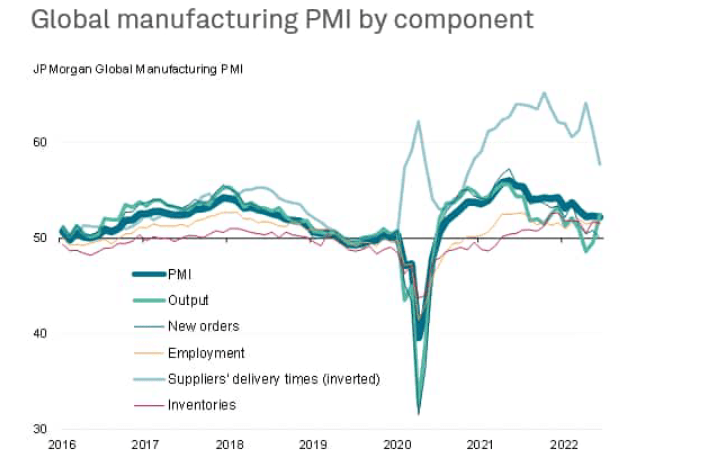
I’d like to start off by looking at PMI data. I was quite astounded when I read a few reports by Markit, which conveyed that global PMI is waning despite pandemic re-openings in China. I firmly believed that re-openings of manufacturing facilities in China would make a significant difference to the supply side of the economy, which it clearly hasn’t been the case.
Furthermore, US PMI data implies that demand in the economy is fading, which is in fact something that I expected.
Markit Markit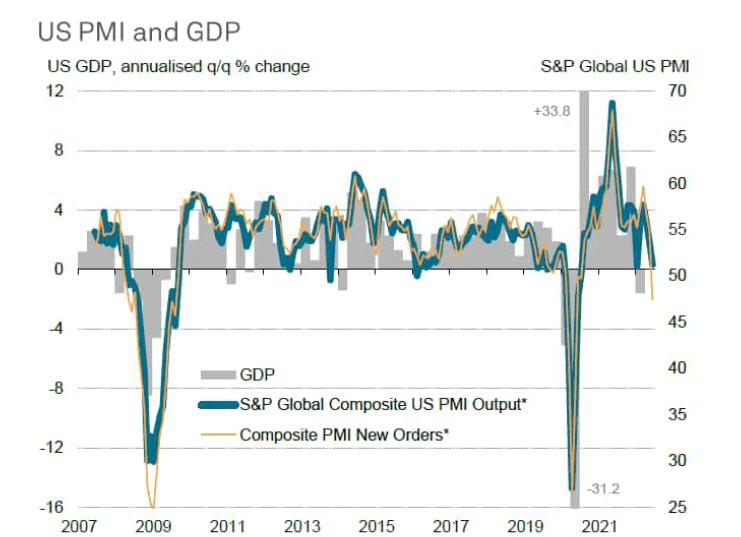
Fading U.S. consumer spending is quite visible in the Treasury yield curve. For instance, the curve implies that interest rates could settle above 3%, meaning that contractionary economic policy is on its way.
Gurufocus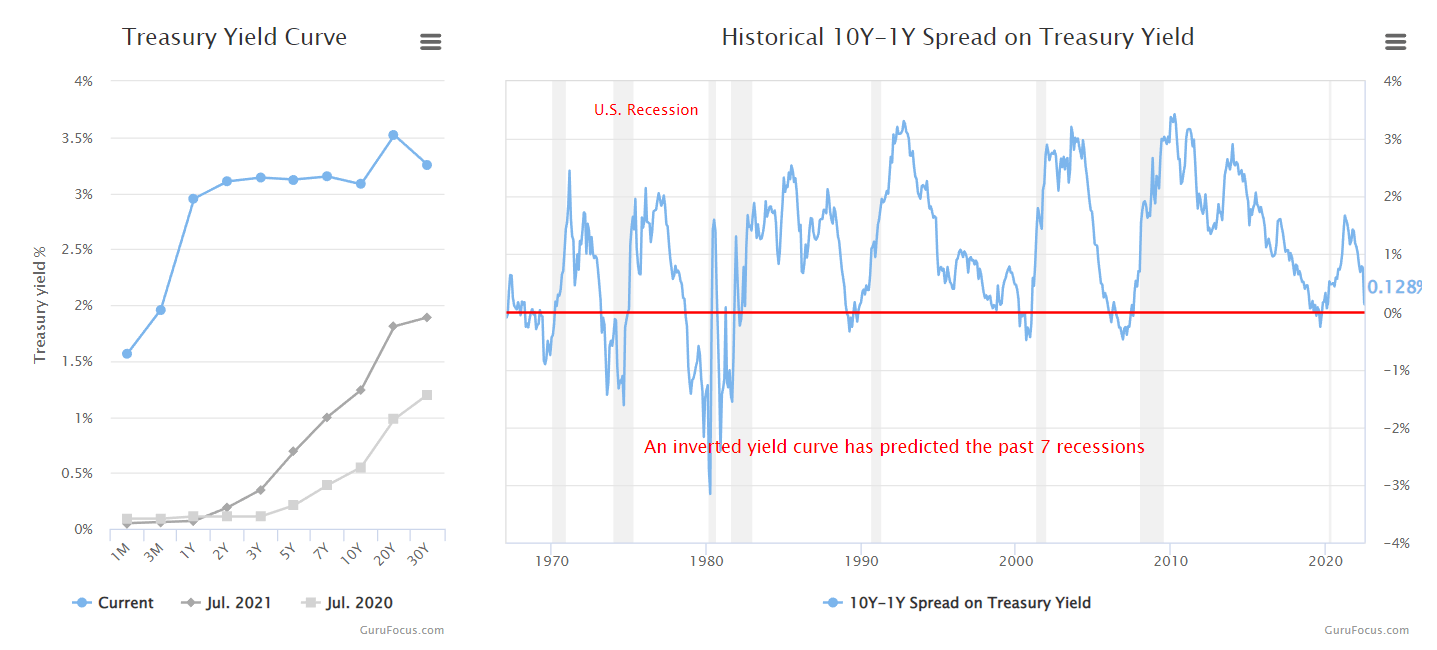
The SPY and S&P 500 alike are filled with technology, consumer cyclicals, and industrials, which could all come under heavy pressure in the case of contractionary monetary policy as they’re cyclical/high-beta industries. Thus, it’s unlikely that the S&P 500’s valuation would be favorable to investors if interest rates realize in the manner that the yield curve implies.
Seeking Alpha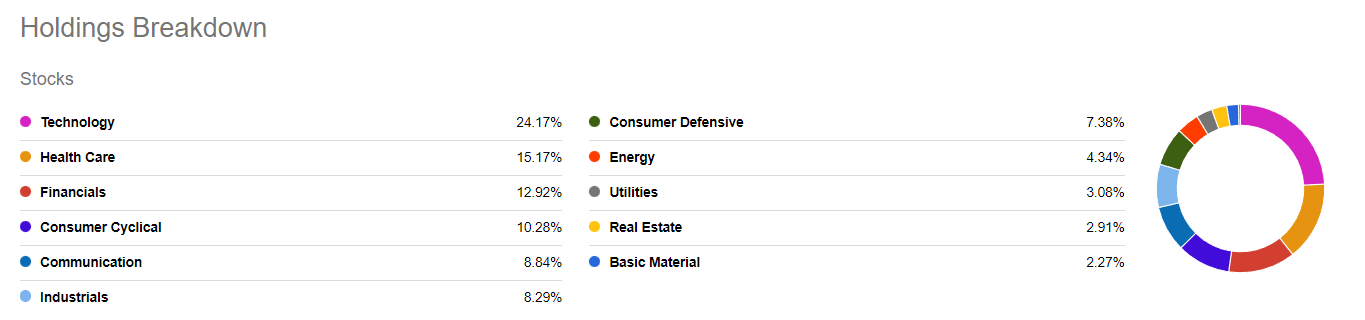
Price Level
If you’re a SPY bear as I am, here’s are a few entry points.
Based on technical analysis, I see two bearish entry points for SPY. Firstly, if the market has a temporary bear market surge, there’s a resistance level at around the $396 mark. Alternatively, if there’s no bear market surge and markets continue falling, there’s a bearish support level around the $357.50 level.
Seeking Alpha; TradingView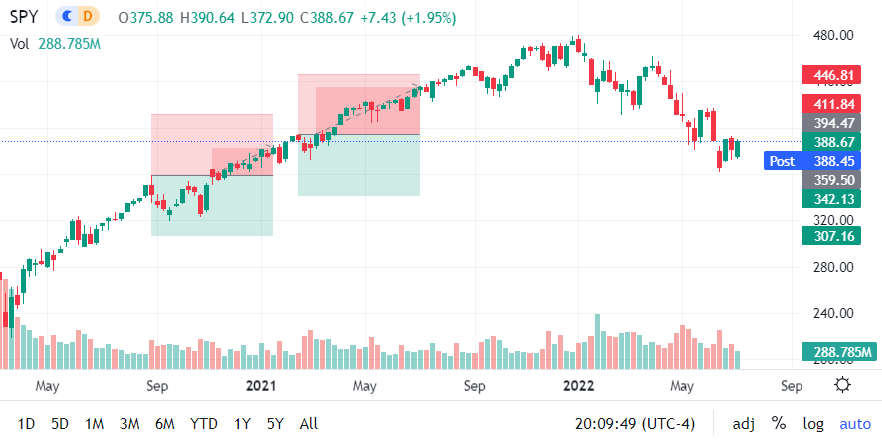
A Counter Argument
Although I’ve provided a few juxtapositions in the previous sections, there’s a need for further counterargument
An alternative argument could be that the S&P 500 has reached its bottom and that it could be a lucrative time to invest in the dip. Additionally, rising interest rates could recede inflation, which could revive pockets of spending power within the U.S. economy.
Furthermore, China’s considering a $200 stimulus package, and the U.S. is dropping various renewable energy tariffs, which could stimulate the economy and, in turn, draw us all out of this bear market.
Lastly, basic GDP growth data points tell us that the U.S. only suffers from negative growth whenever a systemic shock occurs. As such, it’s difficult to bet against the U.S. economy and its stock market.
Statista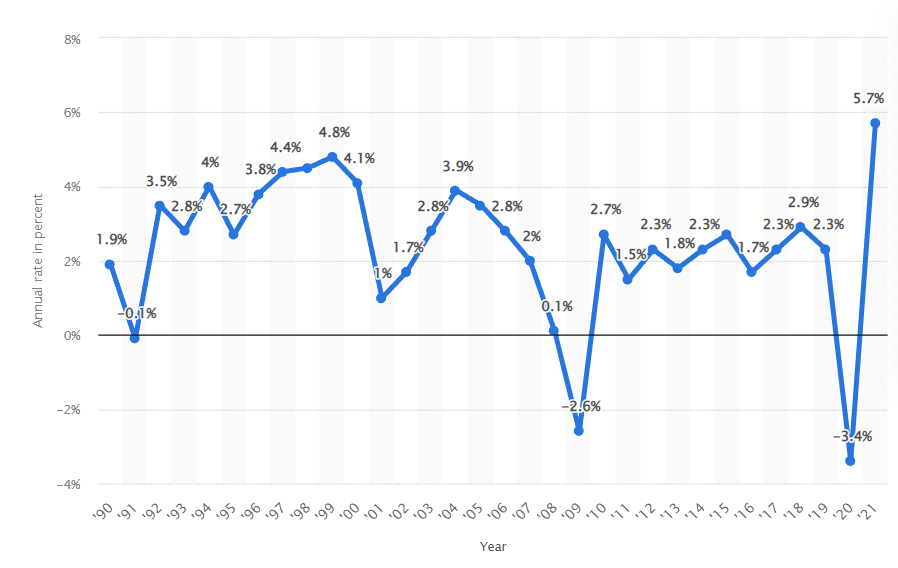
Concluding Thoughts
We believe the SPY has a fair bit of falling to do before it’s at an investable level again. Statistical models and economic theory tells us that it’s unlikely that the index will recover soon. Additionally, technical analysis implies that bearish levels are present.
Whether you’re bullish or bearish on the U.S. stock market, it would be worth considering the content within this article before making an investment decision.