Snap Stock: High Probability Of Further Declines (NYSE:SNAP)
stockcam
Snap (NYSE:SNAP) reported Q3 results on October 20th after the market close, with positive quarterly earnings when the consensus indicated a small loss. Q3 revenue was slightly below expectations, however. The number of daily active users grew faster than expected, up 19% to 363M. The lower-than-anticipated revenue growth, combined with management declining to provide Q4 guidance (see slide 15), sparked something of a panic, and SNAP fell 28% on Friday, October 21st. The negative response to the Q3 results reflects growing concern about companies that depend on ad-based revenues as the probability of an economic slowdown has increased. In addition, SNAP is losing out as social media marketers focus their campaigns on other platforms. SNAP is having a hard time monetizing its massive user base, as average revenue per user (see slide 3) has fallen to $3.11 in Q3 of 2022 from $3.49 in Q3 of 2021.
Seeking Alpha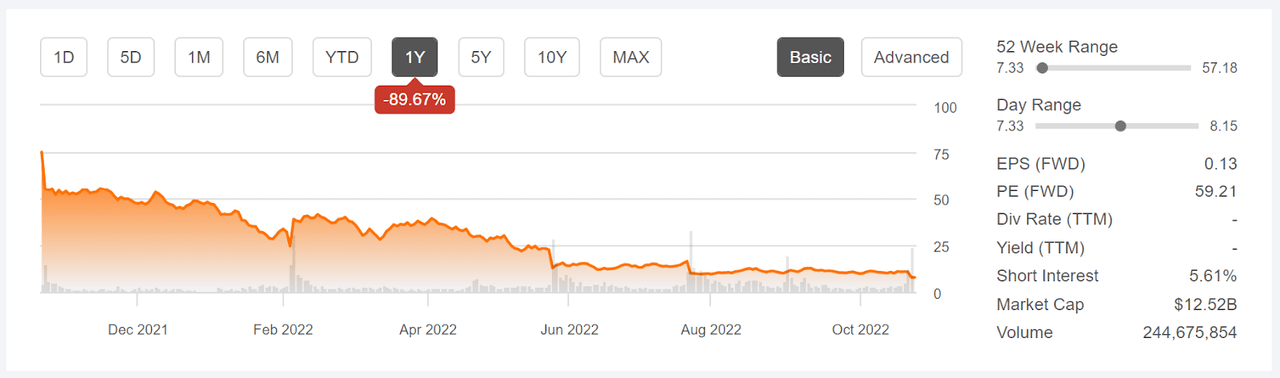
12-Month price history and basic statistics for SNAP above.
With Friday’s drop, SNAP is now down 89.7% over the past 12 months and is now trading at levels not seen since early 2019. The 5-year compounded annualized return on SNAP is -13% per year.
Looking at historical quarterly earnings tells an interesting story. The company was consistently operating at a loss in 2019 and the first half of 2020, before seeing rapid growth from Q3 of 2020 through Q4 of 2021. The situation has reversed dramatically in 2022 (see slide 12). While SNAP is clearly providing engaging services and attracting more users, advertisers are becoming more cautious overall and are directing their resources towards the social media behemoths. The combination of the weakening economic outlook and SNAP’s diminishing strength with marketers, the company faces major headwinds.
ETrade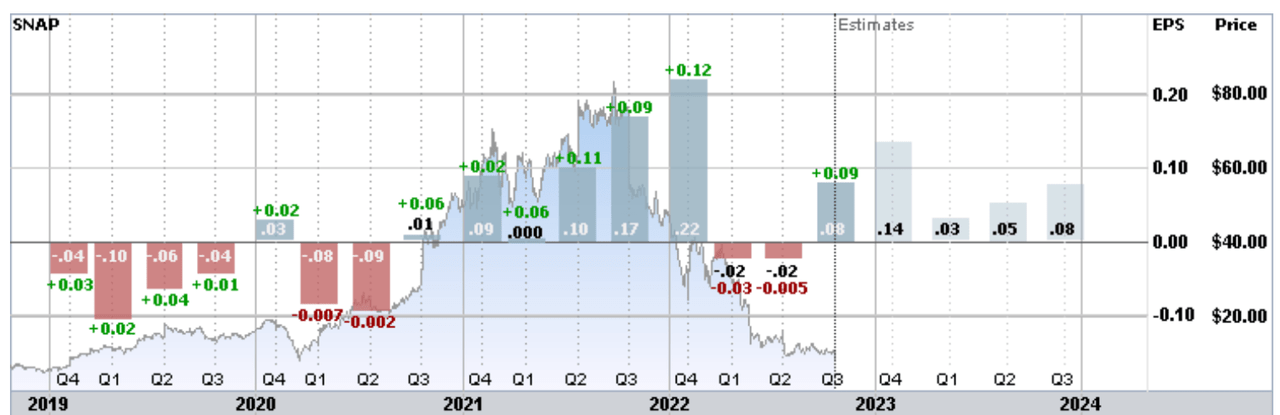
Trailing (4 years) and estimated future quarterly EPS for SNAP. Green (red) values are amounts by which EPS beat (missed) the consensus expected value above.
SNAP has also been pulled down by the substantial rotation from growth to value, as interest rates have risen in 2022. The iShares S&P 500 Growth ETF (IVW) has returned -28.1% for the YTD, as compared to -11.7% for the iShares S&P 500 Value ETF (IVE).
I last wrote about SNAP on April 14, 2022, more than 6 months ago, at which time I assigned a sell rating. Since that post, SNAP has fallen 76.6%, as compared to a decline of 14.4% for the S&P 500. The rapid sell-off in SNAP is even more notable given that the Wall Street consensus rating in mid-April was a buy and the consensus 12-month price target was 60% above the share price at that time. There was, however, a significant red flag in the analyst outlooks: the spread among the individual analyst price targets was very large. While there tends to be a positive correlation between the return implied by the consensus price target and subsequent realized returns, the correlation is negative when dispersion among individual price targets is high. As a rule-of-thumb metric for high dispersion, I largely discount consensus price target for a stock when the ratio of the highest and lowest analyst price targets is at 2 or above. Back in mid-April, this ratio was well above 2.
Seeking Alpha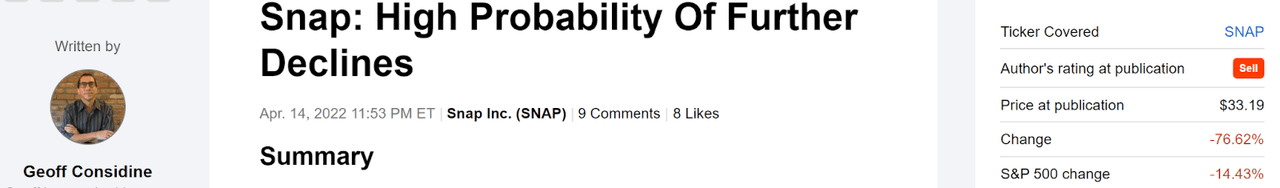
Previous analysis of SNAP and subsequent performance vs. the S&P 500 above.
When analyzing a stock, I also rely on the market-implied outlook, a probabilistic price return forecast that represents the consensus view among buyers and sellers of options. As of April 14th, the market-implied outlook was bearish to early 2023, indicating that the shares were likely to fall further. The expected volatility calculated from the market-implied outlook was 75% (annualized) to the middle of 2022 and 63% to early 2023.
For readers who are unfamiliar with the market-implied outlook, a brief explanation is needed. The price of an option on a stock is largely determined by the market’s consensus estimate of the probability that the stock price will rise above (call option) or fall below (put option) a specific level (the option strike price) between now and when the option expires. By analyzing the prices of call and put options at a range of strike prices, all with the same expiration date, it is possible to calculate a probabilistic price forecast that reconciles the options prices. This is the market-implied outlook. For a deeper explanation and background, I recommend this monograph published by the CFA Institute.
With the Q3 results, along with the 76.6% decline in SNAP since my last analysis, I am revisiting my overall rating. I have calculated updated market-implied outlooks and I have compared these with the current Wall Street consensus outlooks, as in my previous post.
Wall Street Consensus Outlook for SNAP
ETrade calculates the Wall Street consensus outlook for SNAP using the views of 30 ranked analysts who have published price targets and ratings over the past 3 months. The consensus rating is a hold and the consensus 12-month price target is 39.3% above the current share price. It is notable that the consensus rating was a buy over the period during which the shares fell from the mid-$50 range, about a year ago, all the way down to around $10 in late July. As in my analysis in April, the dispersion among the individual analyst price targets is high. The highest, $19, is 2.7 times the lowest, $7. This ratio was 2.6 in April. The combination of a high return implied by the consensus price target and a high dispersion is a bearish indicator.
ETrade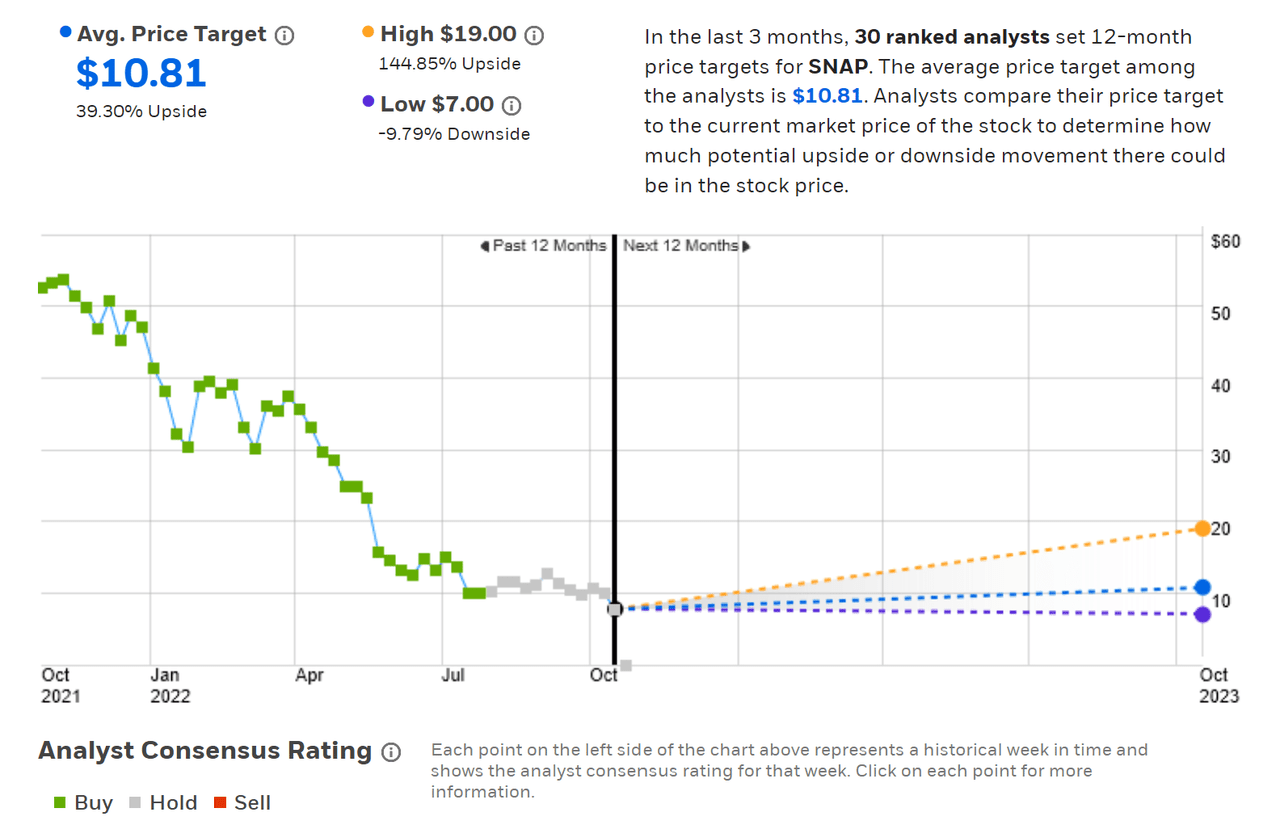
Wall Street analyst consensus rating and 12-month price target for SNAP above.
Seeking Alpha’s version of the Wall Street consensus outlook is calculated using price targets and ratings from 41 analysts who have published their views within the last 90 days. The consensus rating is a hold, although it was a buy as recently as the end of August. The consensus 12-month price target is 50.9% above the current share price. The spread among the individual price targets is very high, similar to the ETrade results.
Seeking Alpha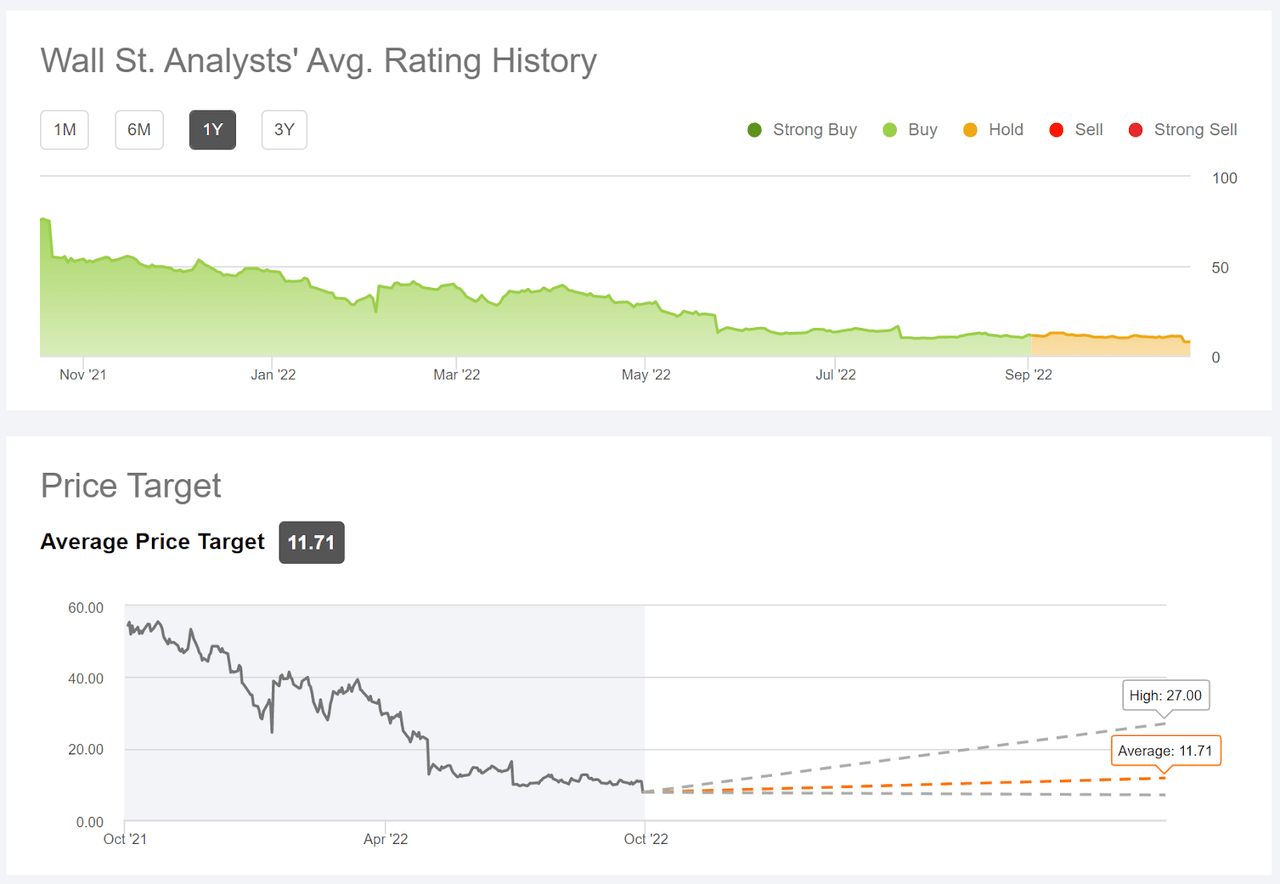
Wall Street analyst consensus rating and 12-month price target for SNAP above.
The prevailing view among Wall Street analysts was bullish in SNAP as the shares fell dramatically. The consensus rating only shifted from a buy to a hold after the shares had declined by about 80%. Consistent with my April analysis, the consensus price target implies high returns over the next year, but the spread in the individual price targets is sufficiently high that the consensus price target actually suggests a somewhat bearish view.
Market-Implied Outlook for SNAP
I have calculated the market-implied outlook for SNAP for the 2.9-month period from now until January 20, 2023 and for the 7.7-month period from now until June 16, 2023, using the prices of call and put options that expire on these dates. I selected these two expiration dates to provide a view through the end of 2022 and to the middle of 2023. In addition, the options trading volume for these two expiration dates tends to be particularly high.
The standard presentation of the market-implied outlook is a probability distribution of price return, with probability on the vertical axis and return on the horizontal.
Geoff Considine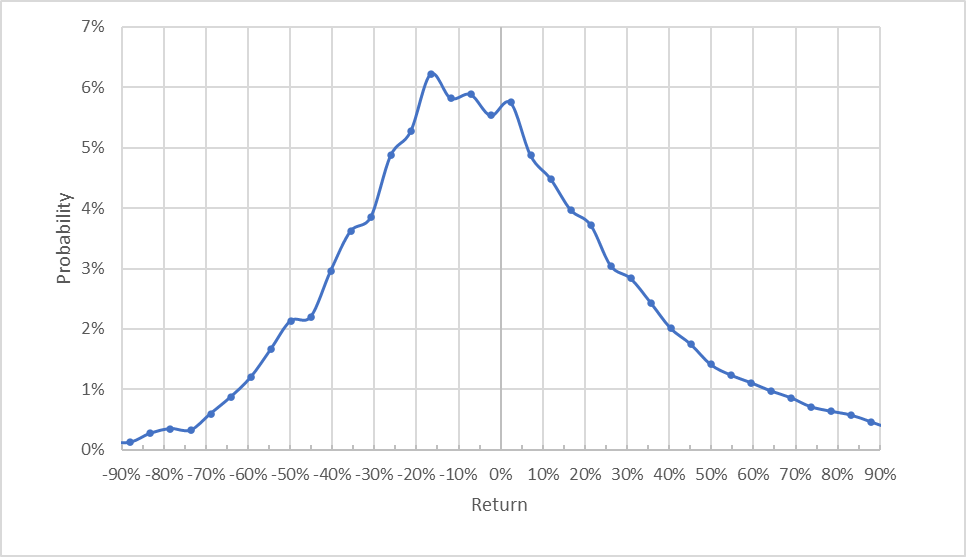
Market-implied price return probabilities for SNAP for the 2.9-month period from now until January 20, 2023 above.
The market-implied outlook for the next 2.9 months exhibits a clear tilt in probabilities to favor further declines. The maximum probability outcome corresponds to a price return of -16.5% over this period. With this tilt, the projected distribution of returns is substantially positively skewed, a property that has been shown to be predictive of lower future returns. The expected volatility calculated from this distribution is 80% (annualized). This outlook is qualitatively similar to the results from April.
To make it easier to compare the relative probabilities of positive and negative returns, I rotate the negative return side of the distribution about the vertical axis (see chart below).
Geoff Considine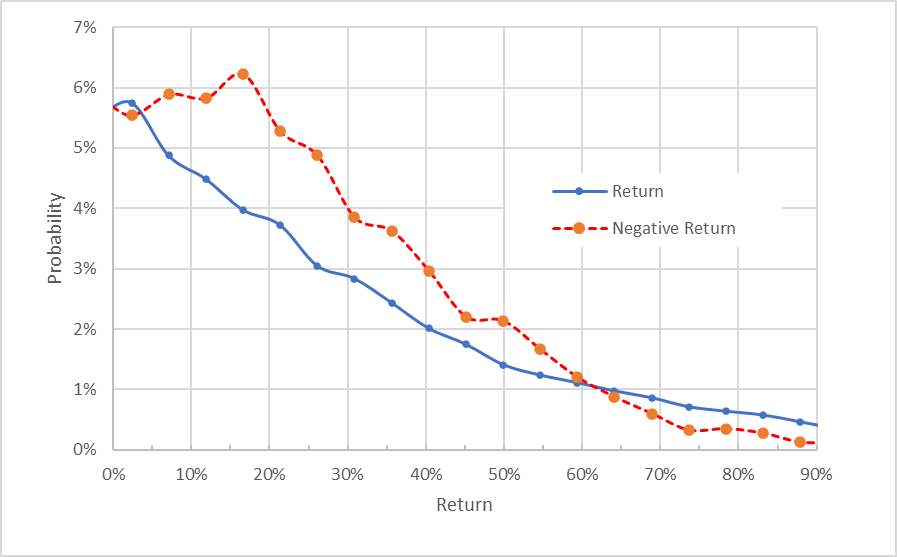
Market-implied price return probabilities for SNAP for the 2.9-month period from now until January 20, 2023. The negative return side of the distribution has been rotated about the vertical axis above.
This view really emphasizes the degree to which the probabilities of negative returns tend to be much higher than the probabilities of positive returns of the same size, across a wide range of the most-probable outcomes (the dashed red line is well above the solid blue line over almost all of the left ⅔ of the chart above). The probabilities of extremely large positive returns is higher than those for negative returns of the same magnitude (the right ⅓ of the chart above), but the overall probabilities of these outcomes are very low. For additional discussion of stocks with this type of projected distribution, see this post. This is a bearish outlook for SNAP.
Theory indicates that the market-implied outlook is expected to have a negative bias because investors, in aggregate, are risk averse and thus tend to pay more than fair value for downside protection. There is no way to measure the magnitude of this bias, or whether it is even present, however. Even with the expectation of a negative bias, this outlook looks substantially bearish on the basis of the range of results that I have observed over the years.
The market-implied outlook for SNAP for the 7.9-month period from now until June 16, 2023 is also very bearish. The maximum probability corresponds to a price return of -41% over this period and the expected volatility is 84% (annualized). There is a small secondary peak in probabilities at a return of -100%, which illustrates that the put options are sufficiently expensive that there is a meaningful implied probability that SNAP will go to zero. This implied probability is probably not meaningful because of the expected negative bias in the market-implied outlook. In practical terms, this secondary peak is simply a manifestation of the very high expected volatility.
Geoff Considine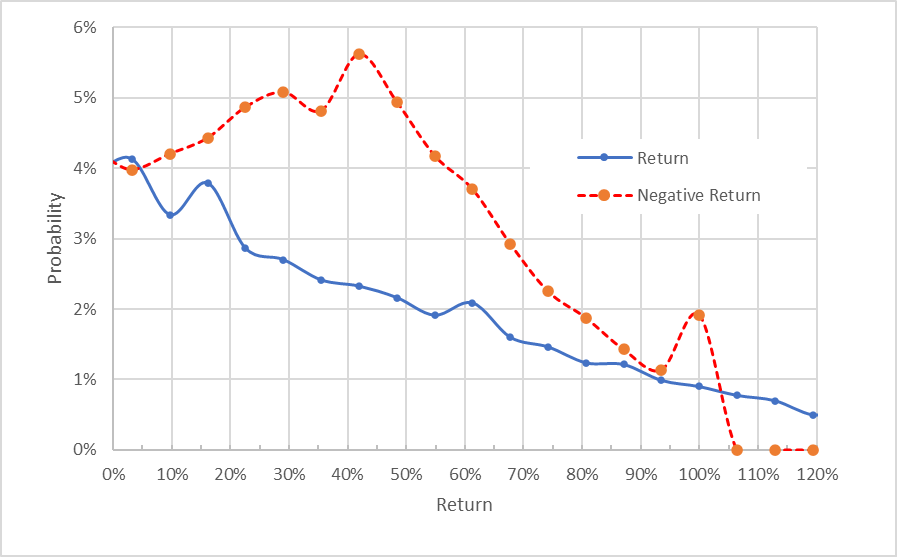
Market-implied price return probabilities for SNAP for the 7.7-month period from now until June 16, 2023. The negative return side of the distribution has been rotated about the vertical axis above.
The current market-implied outlooks for SNAP are consistent with the results from April, which is to say that the outlook is substantially bearish. The expected volatility has increased over this period, which is to be expected given the rapid large price decline in the past 6 months.
Summary
Social media stocks, reliant as they are on advertising revenue, have had a difficult 2022 and the outlook is for further slowing in 2023. Even with solid growth in daily active users, SNAP’s average revenue per user has fallen. The outlook is sufficiently uncertain that management has declined to provide forward guidance. While the prevailing view among Wall Street analysts was unwaveringly bullish, even as the shares fell dramatically, the consensus rating shifted from a buy to a hold in the July-August period. The consensus 12-month price target for SNAP is in the range of 40% to 50% above the current share price, but the dispersion among the individual analyst price targets leads me to discount the consensus and is suggestive of a bearish interpretation. The market-implied outlook for SNAP continues to be robustly bearish, as it was back in April. The expected volatility is very high, as one would expect. I am maintaining a sell rating on SNAP.