PFM: Reassessing Valuation, Quality, And Dividend Credentials (NASDAQ:PFM)
William_Potter/iStock via Getty Images
Invesco Dividend Achievers ETF (NASDAQ:PFM) has a U.S.-centered dividend growth strategy revolving around consistent DPS growth.
The previous time I covered this DGI portfolio was in November 2021, assigning it a Hold rating, as the combination of factors PFM had back then was insufficient to upgrade it to a Buy. Today, I would like to provide a comprehensive overview of the fund’s valuation, quality, and dividend credentials to arrive at a conclusion about whether this investment vehicle has appeal at the current levels after an almost 11% decline year-to-date. Let us dig in.
Investment Strategy Summary
To recap, PFM’s investment mandate is to track the modified market-cap-weighted NASDAQ US Broad Dividend Achievers Index, which is reconstituted annually in March. To qualify for the cohort, a stock from the NASDAQ US Benchmark Index must have no less than a 10-year regular dividend growth history. Those that met this criterion while also possessing certain liquidity characteristics are selected, with individual stocks’ weight capped at 4%. More details can be found in the methodology.
Factor #1: Valuation
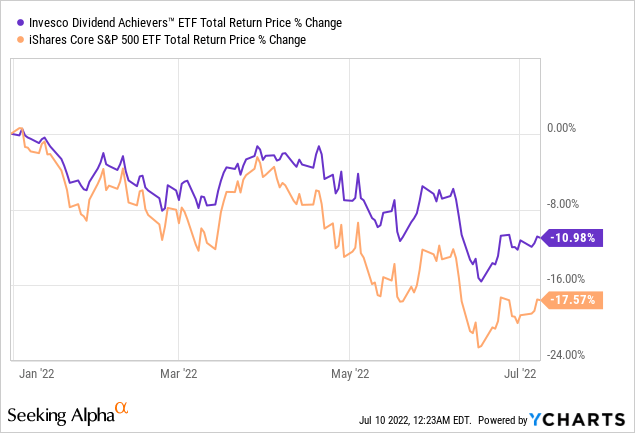
Since my November 2021 note, PFM has delivered a negative total return of 7.7%, which is better compared to the S&P 500’s decline of close to 16%. Besides, the portfolio was reconstituted in March. Overall, since November, 44 stocks (~8.9% weight, including Amgen (AMGN)) have been added and 21 stocks (~2.6% weight, including Valero Energy (VLO)) have been removed. Soft performance and portfolio recalibration together beg a question of whether a shift in its valuation profile can be observed upon careful inspection.
Since PFM tracks a modified market-cap-weighted index, I should warn value investors that this vehicle will likely remain comparatively expensive even during market turmoil. That is to say, even when excesses are being wrung out across all the corners of the market, the fund will still be overweight in the mega/large-cap echelon, with all valuation issues inherent to it.
Turning to the Quant Valuation ratings, we see just 11% allocated to stocks with a B- score or better. Unfortunately, the share has even declined compared to November 2021, when PFM had over 17% allocation to such names. Over 59% are overvalued as their D- and worse ratings hint, vs. ~52% in November.
Below is the Quant data table with the top 25 holdings of PFM; as you can see, just two stocks in this group are attractively priced, Pfizer (PFE) and Cisco (CSCO).
Created by the author using data from Seeking Alpha and the fund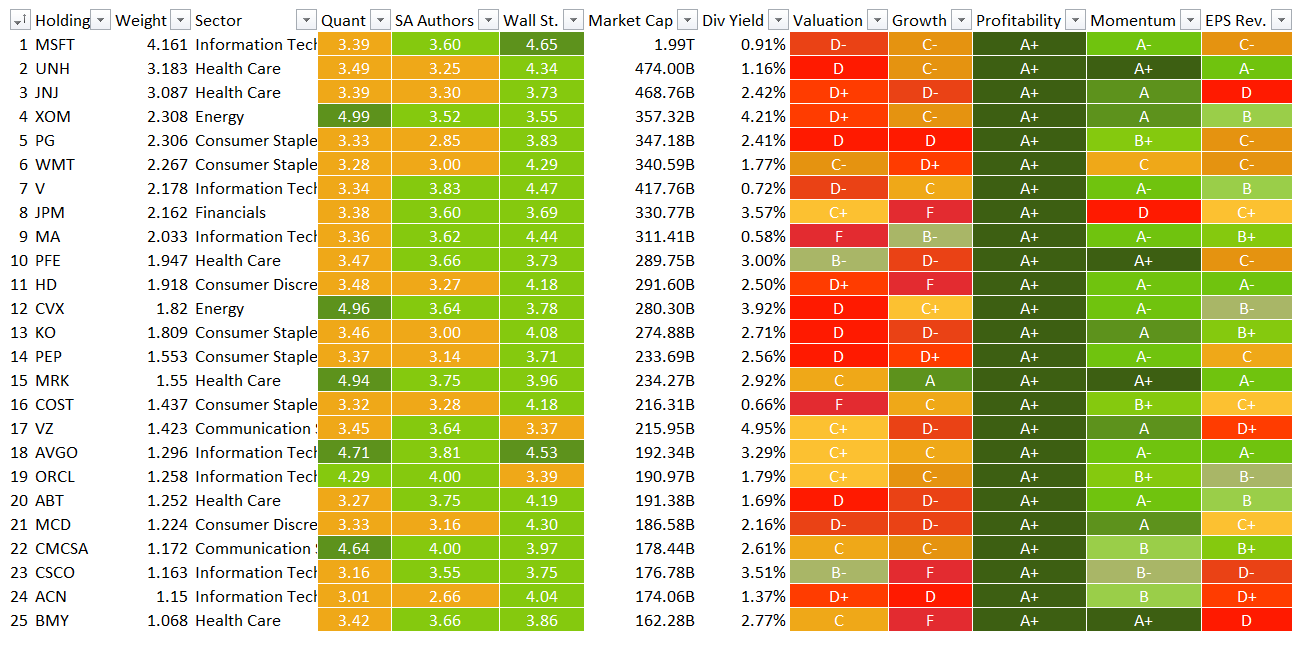
To bring a bit more color, I computed FCF yields for PFM holdings outside the financial and real estate sectors. For those 191 stocks with positive FCF, the median yield amounted to 4%. Is this acceptable? Mostly yes, for a strategy just targeting dividend growth and ignoring quality and value metrics. But for better context, the Cambria Shareholder Yield ETF (SYLD), a value-seeking fund I have covered just recently, boasts a ~12.6% median FCFE yield for non-financial stocks.
Factor #2: Quality
To quickly assess whether a U.S.-centered portfolio has hidden quality issues, I principally use the Quant Profitability rating. PFM is no exception today.
In terms of profitability (encompassing a plethora of metrics from the net margin to cash flow and Return on Total Capital), there is little to no to criticize. Though just 253 out of 374 holdings have no less than a B- rating, they account for almost 95% of the net assets. Mid- and small-caps have just ~2.6% weight, and mega-caps account for 60%. As I constantly repeat in my articles touching on ETFs, a larger market cap means higher quality in most cases. PFM’s characteristics reinforce this point once again.
A group of 25 stocks with the highest Profitability ratings (A+) is presented below. As my dear readers can see, the quality factor here inversely correlates with growth and value.
Created by the author using data from Seeking Alpha and the fund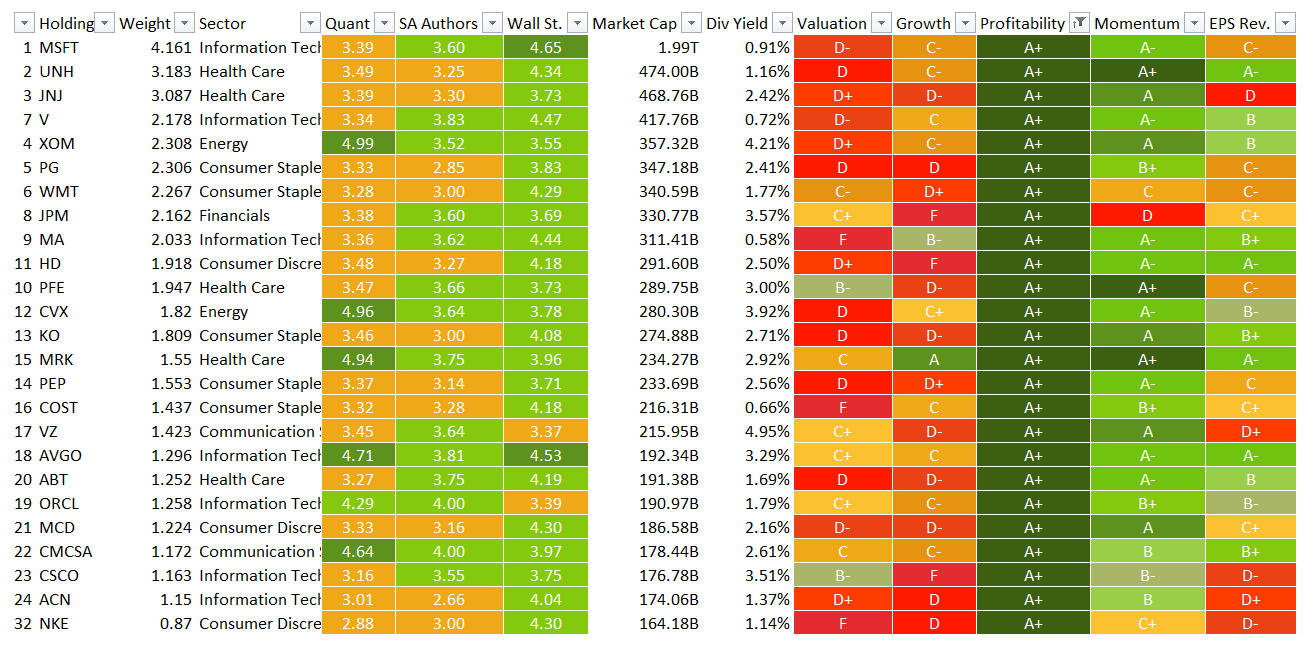
As an additional quality/dividend durability screen, this time I computed the FCF margins for stocks outside the financial and real estate sectors and also compared them to the net income margins where applicable. I found out that just 65 (~38% weight) have FCF (net CFFO less capex; acquisitions are not taken into account) greater than or equal to net income, principally those companies from the healthcare (11% weight, like Abbott (ABT)) and IT (~8.4%, like IBM (IBM)) sectors.
The scatter plot below compares the NI and FCF margins:
Created by the author using data from Seeking Alpha and the fund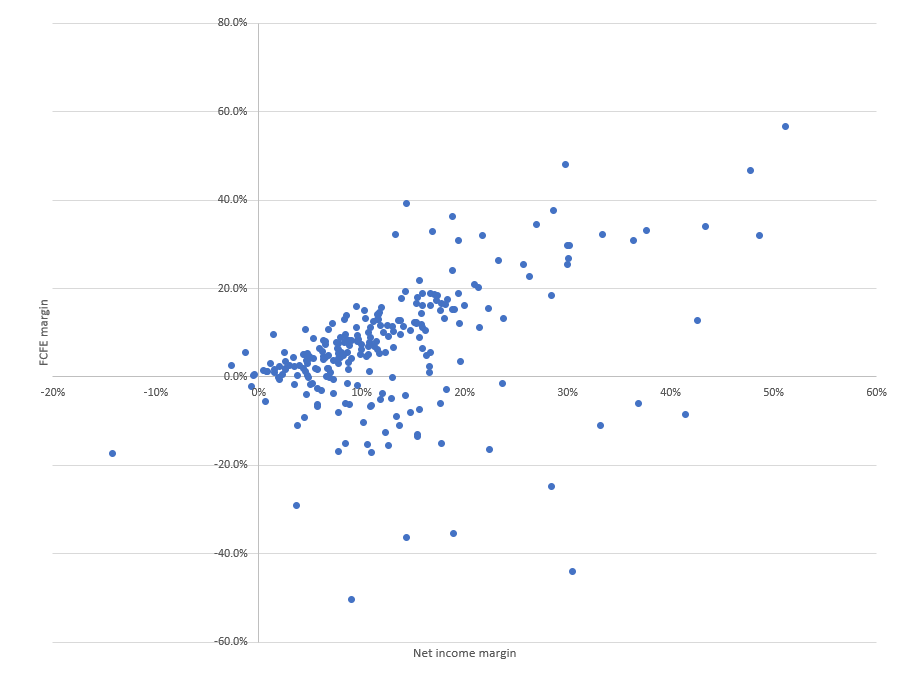
The reasons for net income being higher than FCF may vary from temporarily working capital build-up (working capital fluctuations eat into FCF, though this is not necessarily an indication of a company’s imminent collapse) to more complicated to navigate like margin compression due to competition or inability to adapt pricing to inflation, etc.
But temporary or not, stocks with the FCF/net income ratio below 1 do have a risk of dividend reduction, especially in case of a recession.
Factor #3: Dividend Credentials
PFM’s holdings have a combination of the SA Dividend grades that barely comes as a surprise for a market-cap-weighted mix focused on dividend consistency and growth.
- Close to 82% have a solid Safety rating (B- and above).
- A similar amount of the net assets is allocated to those with attractive DPS growth stories, 81%.
- Meanwhile, just 35% sport an appealing Yield rating. No coincidence for a mix ignoring the value factor.
- Finally, over 91% have a strong Consistency score, like Microsoft (MSFT).
It should be noted that PFM’s dividend compound annual growth rates have improved meaningfully since my previous article, with a 3-year CAGR rising from 3.85% to 9.91% and a 5-year CAGR from 4.82% to 7%. Though an inspiring development, I believe this alone is not enough to upgrade the ETF to a Buy.
Seeking Alpha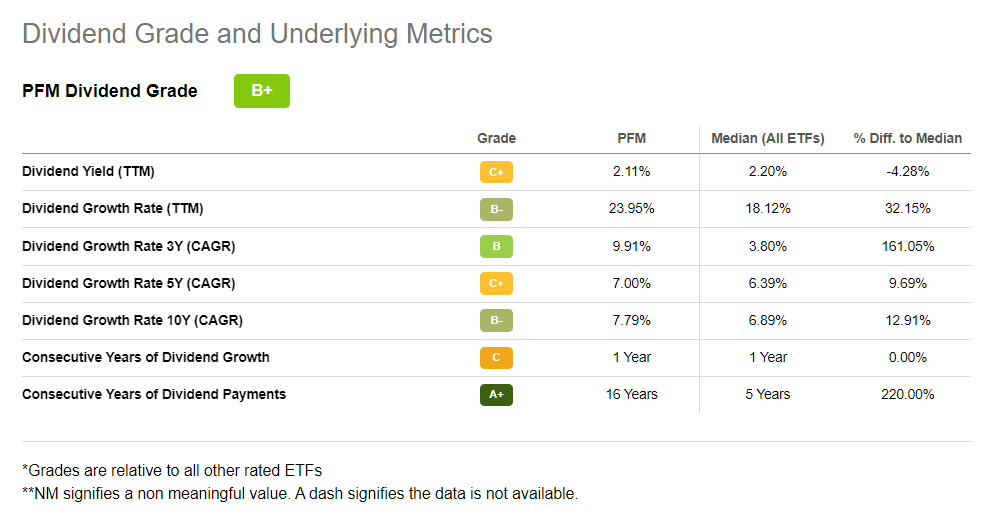
The Verdict
PFM is built around a comparatively simplistic U.S. large-cap-focused dividend growth strategy. This vehicle offers a nice option to express a bullish opinion on the kings and aristocrats league, while also maintaining large exposure to shorter dividend growth stories for the sake of diversification.
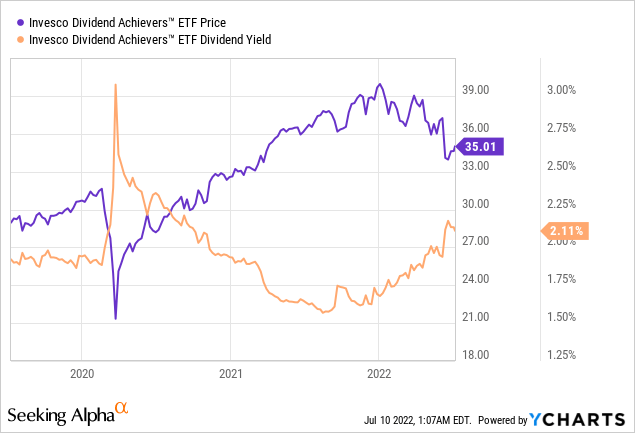
The principal downside is that the PFM portfolio is rife with riskily valued stocks, partly owing to its strategy favoring mega-caps and also due to the IT (19.5%) and healthcare (16.2%) sectors occupying the two leading positions. Principally due to valuation, the fund’s yield of 2.1% is only marginally higher compared to the iShares Core S&P 500 ETF’s (IVV) 1.5%.
The last time PFM offered a yield close to 3% was during the March 2020 market sell-off.
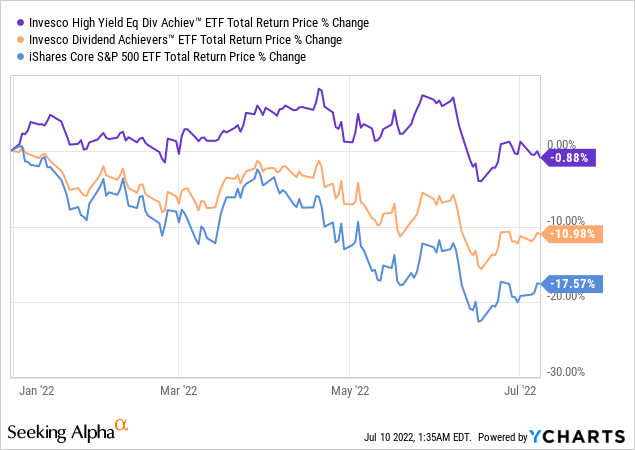
That said, its ~4% yielding value-focused peer Invesco High Yield Equity Dividend Achievers ETF (PEY) might be a better option for income-focused investors. It merits mentioning that the financials and utilities-heavy PEY portfolio has fared way better this year compared to PFM, delivering a minor negative total return.
Most importantly, regarding valuation, the ETF clearly has an edge over PFM as 63% of its net assets are allocated to stocks possessing at least B- Valuation grade.
There are solid bright spots on the quality side, but I see no meaningful reason to hold PFM only for exposure to highly profitable companies. A mix with similar quality can be found in IVV, for example. Finally, its expense ratio of 0.53% is fairly high; this is also the case with PEY. Summing up, it is unattractive.