Nike Stock: Yes, I Am Buying For The Long-Term A True Compounder (NYSE:NKE)
code6d
Introduction
Let’s start the other way around this time by looking at a chart. We are talking about Nike (NYSE:NKE) and we are looking at chart where we see the stock price of the past 30 years. In orange, we see another metric: return on capital employed. Now, while the stock price has been skyrocketing, the ROCE has been stuck within a range usually between 20% to 30%.
Some may already understand what my point might be. But let me ask, in any case, the question that arises: how can a rather flat line drive upwards so strongly the price?
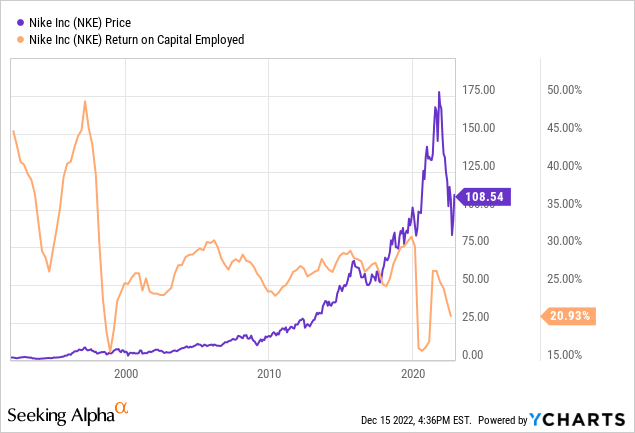
The answer is simple: compounding. Nike is one of the best compounders in the world and it has been able to a long period of time to employ its capital at a high rate of return. Year over year this leads Nike to having a greater and greater return on its investments which is then employed once again in the business to foster its growth and obtain even bigger gains. A 20% ROCE now generates a lot more money compared to the same ROCE in 1999.
This is one of the main aspects that has led me to start researching Nike up to the point it became a part of my portfolio. Now, I am currently considering to build a bigger position taking advantage of the recent drop in price and the possibility that this year’s bear market may yet drive stocks down a bit.
The company
Nike is known worldwide and it currently is the 10th most valuable brand in the worlds, with an estimated value of $50.29 billion.
Its revenues come from highly appreciated products that fall under three categories: footwear, equipment and apparel.
As seen below, the company has a significant chunk of its revenues in North America (41%) with EMEA and Greater China coming in second and third place respectively (28% and 17%). Finally its revenues are pretty much split between wholesale and Nike direct.
NIKE 2022 Annual Report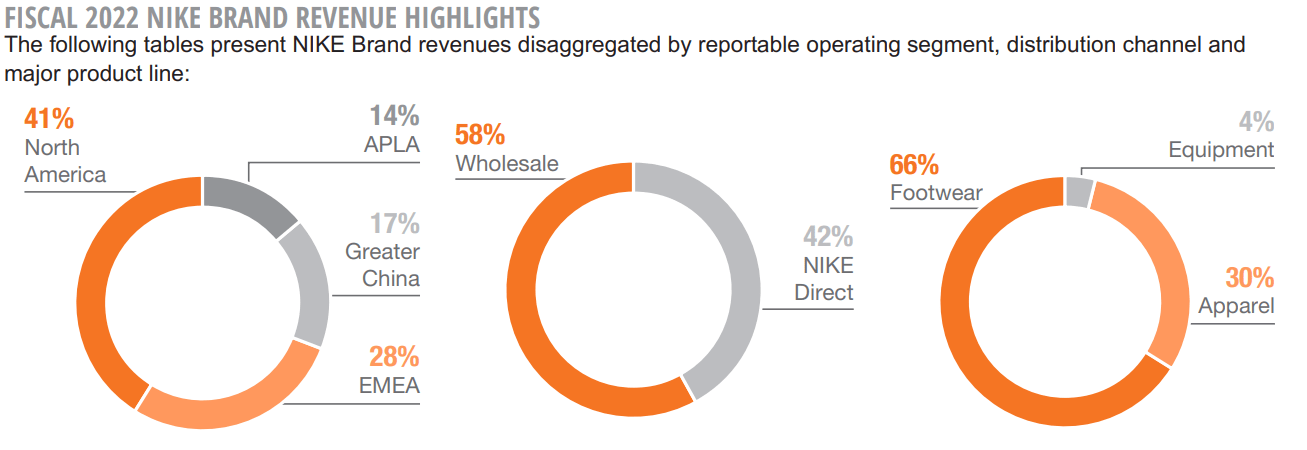
In the shareholder letter that introduced the 2022 annual report, Nike published these highlights to give investors a sense of what the company has been up to in recent years. Starting from revenue performance, we see a 28% increase from $36.38 billion to $46.71 billion in the fiscal year concluded on May 31st 2022. This makes me think that, by 2024 at the latest, the company should break the $50 billion revenue barrier. However, while revenue increased by 28%, the EPS have had a huge surge and increased by 220% in 5 years.
NIKE 2022 Shareholder Letter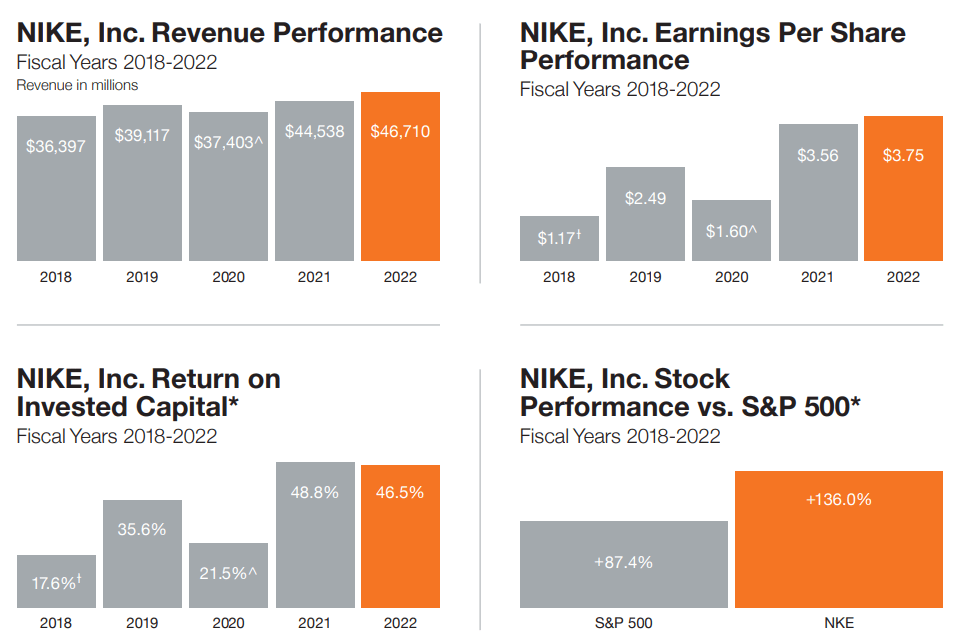
The two charts below show something similar to what we saw at the beginning of the article: a high return on invested capital which is able to push upwards the stock at a faster pace compared to SPY500.
Nike’s sales structure
Nike ends its fiscal year in May. This is why we are currently waiting for its Q2 earnings which account for the months of September through November. Usually, revenues in the first and fourth fiscal quarters slightly exceed those in the second and third fiscal quarters. In fact, Q1 and Q4 for Nike are in the spring and the summer of the northern hemisphere, when sporting and outdoor activities increase.
The company’s product offerings are designed for men, women and kids. Nike also designs products specifically for the Jordan Brand and Converse. In the U.S., where Nike and Converse sales account, as we have seen, for 40% of total revenues, the company operates 344 retail stores.
Outside of the U.S., where Nike grosses 61% of its total revenues, the company has 702 retail stores. It is also important to know that Nike doesn’t sell its products only through its stores but also through many other retailers and, most importantly, through its online e-commerce.
Nike isn’t dependent on any particular customer, as its three largest customers outside of the United States accounted for approximately 14% of total non-U.S. sales. In addition, the company disclosed that no customer accounted for 10% or more its revenue during its fiscal year 2022.
The sports and activewear industry
Before we take a look at Nike’s results, it is helpful to shed some light on the market Nike addresses. First of all, the activewear industry is being fueled by consumers who seek gear and equipment for their physical activities. This is a growing trend, as consumers become more and more careful about a healthy lifestyle.
The global apparel and footwear market is estimated to have reached a value of $1.8 trillion in 2021. The market is also projected to grow at a CAGR of 6.90% between 2023 and 2028. This means that by 2028 the market should be worth around $2.9 trillion.
Statista.com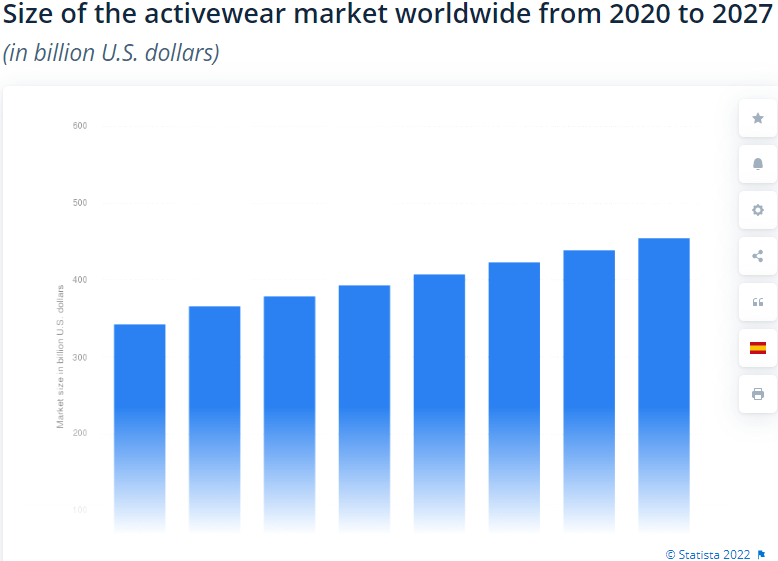
The market is expanding not only thanks to the expansion of e-commerce channels but, most importantly, due to a change in people’s way of dressing that is seeing a trend towards the so-called “casualization of fashion”. For example, it is more and more common, especially in young working environments or in tech and software companies, to go to work without a true dressing-code.
Now, according to statista.com, Nike holds 27.4% of the market. In addition, 64% of U.S. millennials and Generation Y reported that they bought athletic shoes in 2021. This is further proof a rise of streetwear style that makes younger generations look at activewear as part of their personal fashion style.
In the last 12 years, Nike has always been the most favorite clothing brand among 31% of American teens. Just to get an idea of how strong Nike is, the second favorite brand is currently Lululemon (LULU) with only 6%. Adidas (OTCQX:ADDYY) ranks 7th with 3% of American teens picking it as their favorite brand.
There is a trend that is clearly bonding sportswear to fashion and this is why women’s sportswear generated $35.57 billion in 2021 more than men’s and children’s sportswear combined. Traditionally, women spend more on fashion and this huge spending amount proves that sportswear is attracting more and more attention (and money) from the consumer.
It is no hard guess to know that the U.S. is the largest player of the industry. Here, by 2025 the activewear industry should reach a value of more than $95 billion. If we look at the graph below, we see that in the U.S., Nike was the top earner, leaving competitors such as Adidas and Puma way behind. Moreover, Nike is growing at a faster pace compared to the other two, thanks to the fact that it is more and more perceived as a true fashion brand that is somewhat of a status symbol and can thus understood as part of the luxury goods people want.
Statista.com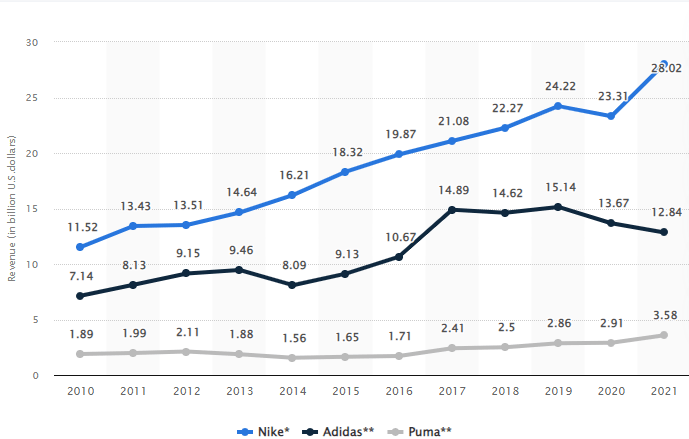
What I think is important to understand is that Nike has become a brand that most people want to wear and, given this strong demand, it can price its merchandise appropriately with margins that we see in luxury companies.
Accordingly, the multiples Nike trades at are those of this latter industry.
Financials
Let’s look at some of the most recent results. In fiscal 2022, the company’s revenue was up 5% YoY at $46.71 billion with a gross margin of 46% that totaled $21.48 billion. The margin increased 120 basis points YoY, which is quite interesting given the fact that the past year has seen many businesses feel margin pressure due to fuel costs and, more in general, inflation. Net income, at the end, increased 6% YoY reaching $6.05 billion that translated into $3.75 EPS versus $3.56 the prior year (a 5% increase).
Speaking of margins, in the last annual shareholder meeting, Matt Friend, Nike’s CFO, explained how the company, since the pandemic started, experienced a margin expansion, explaining that a key driver was the digital business where consumers can purchase Nike’s products in direct connection with Nike itself:
Over the last two years, our gross margins have expanded by over 260 basis points to 46%. And as you’ve heard earlier, our financial performance this year was led by strong double-digit growth in our own digital business now representing 24% share of our overall brand revenue. And that compares to 10% share in fiscal 2019. One of Nike’s longstanding competitive advantages is the deep relationships that we have with our consumers. And we know that our consumer wants to have a direct connection with Nike.
Nike’s balance sheet is something I also appreciate as its cash and cash equivalents is almost equal to its long-term debt ($8.57 billion and $8.92 billion respectively). This means that the company is not levered with a net debt position. In addition, its net debt/EBITDA ratio is around 0.15 which tells us how financially strong this company is.
What I like a bit less is something I find in the consolidated statements of cash flows. Speaking of its free cash flow, the company’s free cash flow has been trending slowly upwards, but not as consistently as other metrics.
Seeking Alpha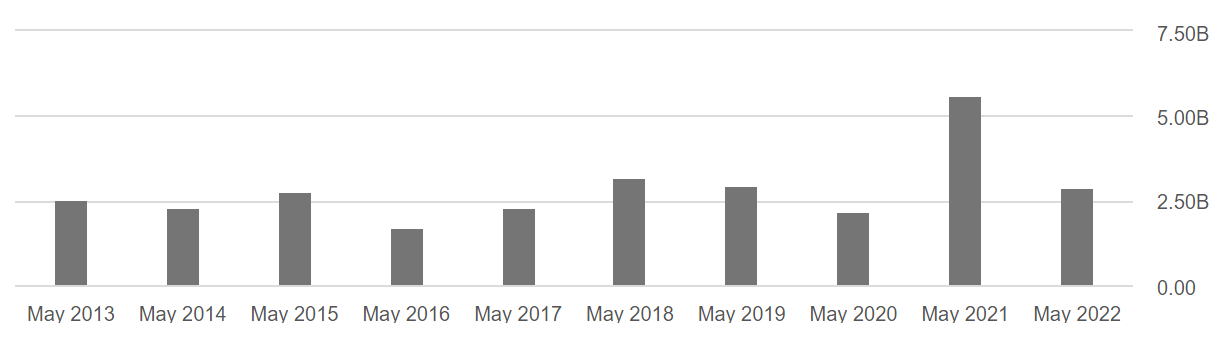
However, what I find a bit concerning from a shareholder point of view is the exponential increase in stock-based compensation, which, as we can see from the graph below, has almost doubled from 2019 until now, moving from $325 million to $638 million in fiscal 2022. This is now equivalent to 22% of the total free cash flow, which, in my opinion is a bit too much.
Seeking Alpha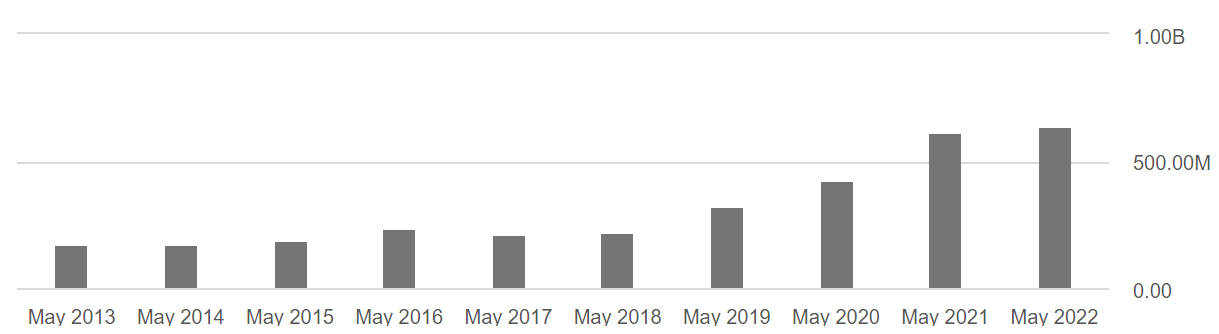
We also have to consider Nike’s share repurchase program. In 2018, it approved a $15 billion share repurchase program that was finished in August 2022. In June 2022, Nike authorized a new four-year, $18 billion program to repurchase shares of its class B common stock.
However, while in fiscal 2022, the company repurchased a little more than $4 billion of its own stock, it also issued new shares for an amount that is equal to $1.15 billion, partially offsetting its share repurchase program. As the company explains in its annual report:
The Stock Incentive Plan provides for the issuance of up to 798 million previously unissued shares of Class B Common Stock in connection with equity awards granted under the Stock Incentive Plan. The Stock Incentive Plan authorizes the grant of non-statutory stock options, incentive stock options, stock appreciation rights, and stock awards, including restricted stock and restricted stock units.
Overall, the company is still generating a lot of free cash flow and it is reducing its share count. However, I am watching closely the company from this point of view because, though sometimes forgotten, it can have a big impact on total returns since the issuance of new shares and stock-based compensation have a diluting effect for the other shareholders.
But one of the things I like the most about Nike is that it is able to achieve a very high ROIC, which, at the end of fiscal 2022 reached 46.5%, down 230 basis points from fiscal 2021. However, though it decreased, we are still before a very high return on the invested capital.
Here is how the company calculates its ROIC, which, as most readers know, is a non-GAAP financial measure. The company uses the formula NOPAT/Total invested capital.
NIKE 2022 Annual Report
I must acknowledge that this metric we have just seen enticed me strongly to buy into the stock.
Problems of the last quarterly report
When Nike published its Q1 2023 results investors were concerned about two main issues. The first one was already known: China. In fact, although the company has been rated the number one cool and the number one favorite brand in the country, Nike has seen its revenues decrease in 2022, as shown below.
NIKE 2022 Annual Report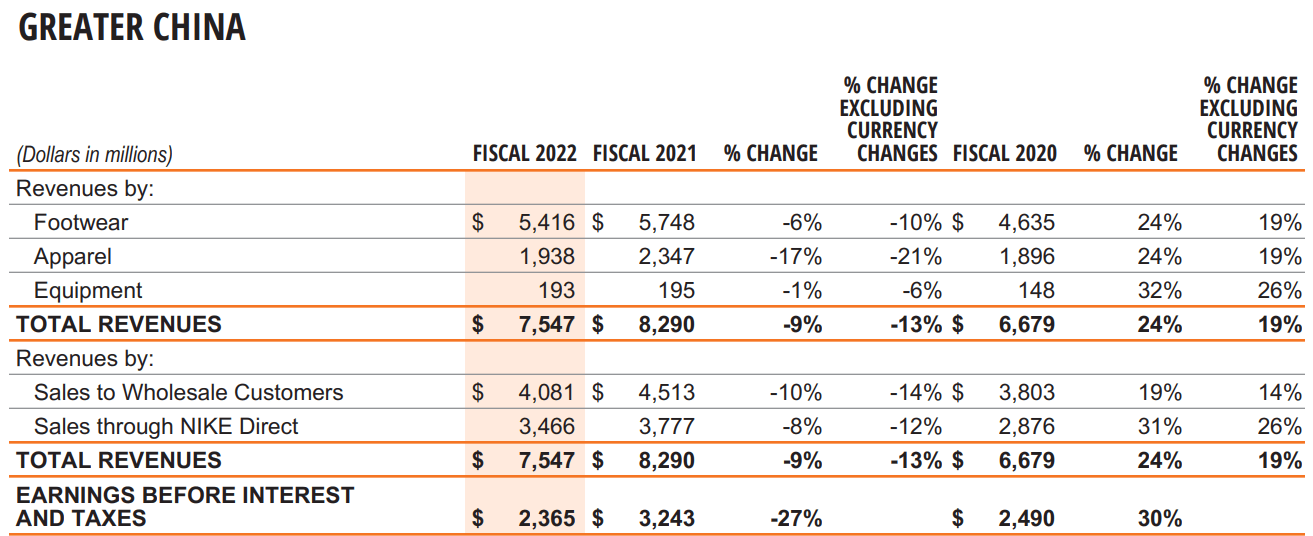
In the first quarter 2023, China dropped a further 16% YoY. However, it is clear why it did so: Covid-19 restrictions. Therefore, I strongly believe that many investors are underestimating the impact that Nike will see on its results once these restrictions ease up, as they have started. We may actually see a couple of quarters, if not a whole year, of what is often called revenge-spending.
The other issue was high inventory in North America which caused the overall gross margin to shrink by 220 basis points to 44.3%. As the company wrote in its report: “the overall decrease in margins was primarily driven by North America, which took measures to liquidate excess inventory through NIKE Direct markdowns and wholesale marketplace actions”.
While this may be a headwind in the short term, I would like to explain why I am not very concerned. First of all, high inventories have been caused all over the places by supply chain bottlenecks. It is not caused by mismanagement. Furthermore, demand is so strong for Nike’s products that through markdowns and discounts the company can lower its inventory while selling them still at very good margins (44.3% instead of 46.5%). It is not something that chopped gross margin in half.
Valuation
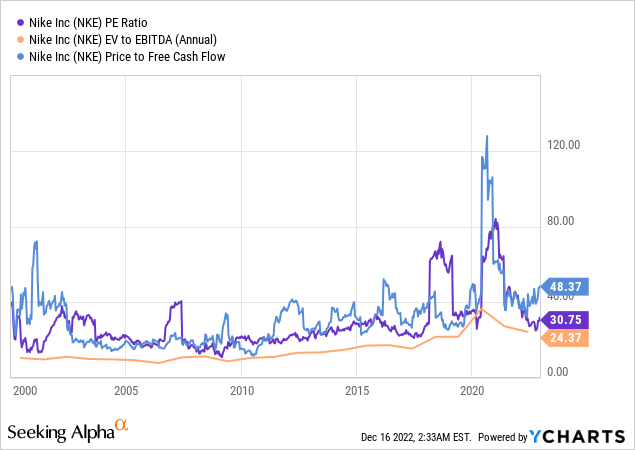
Let’s look at three standard metrics that are often used to get a quick understanding of how cheap or expensive a stock is. When considering the PE ratio (purple line), we see that we are in the lower part of a range that can stretch out to 40 and at times even over 60. The EB/EBITDA ratio (orange line), though it has been trending slowly upwards, is now on a dip and it is back to is pre-pandemic levels. When we look at the price to free cash flow ratio (blue line), we see that the Nike has become more expensive over time, but it is now back to the higher part of the pre-pandemic range. Meanwhile, Nike has become an even stronger brand. Overall, I think we are in a buying territory.
If I check also with my simple discounted cash flow model, I reach a similar conclusion, we are at the beginning of a buy zone. If I plug in a 6% growth for next year, then decreases over the next decade by 0.25% every year (it is my way to factor in any possible recession) and I keep the EBITDA margin at 17% and increase taxes at 11%, we can see that, based on three possible price/free cash flow exit multiples, we are before a stock that has more upside than downside.
Author, with data from SA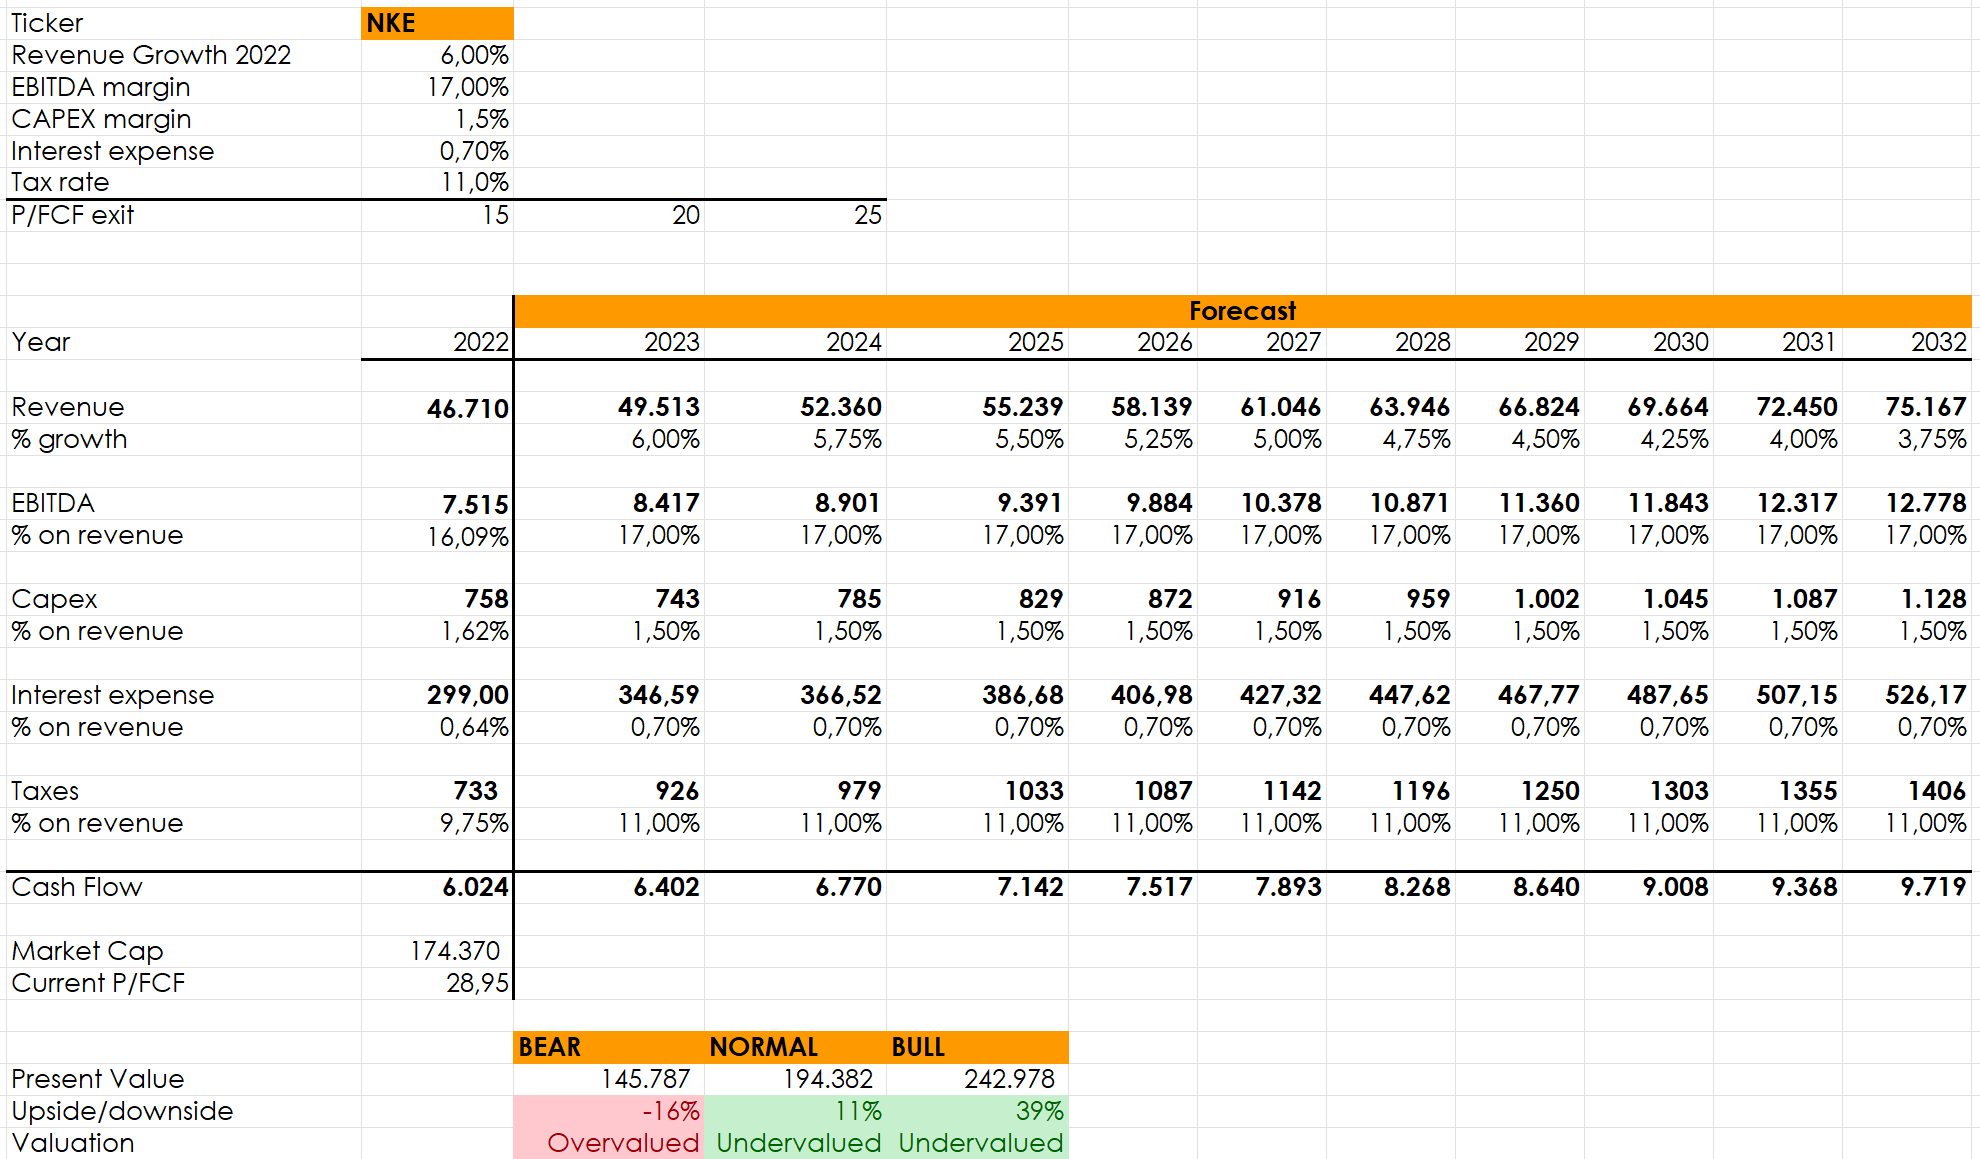
If I plug in more aggressive price/free cash flow multiples, which are more in line with what Nike usually is granted, we see that the upside becomes quite interesting as we have a bull case scenario that could even deliver something more than 2x.
Author, with data from SA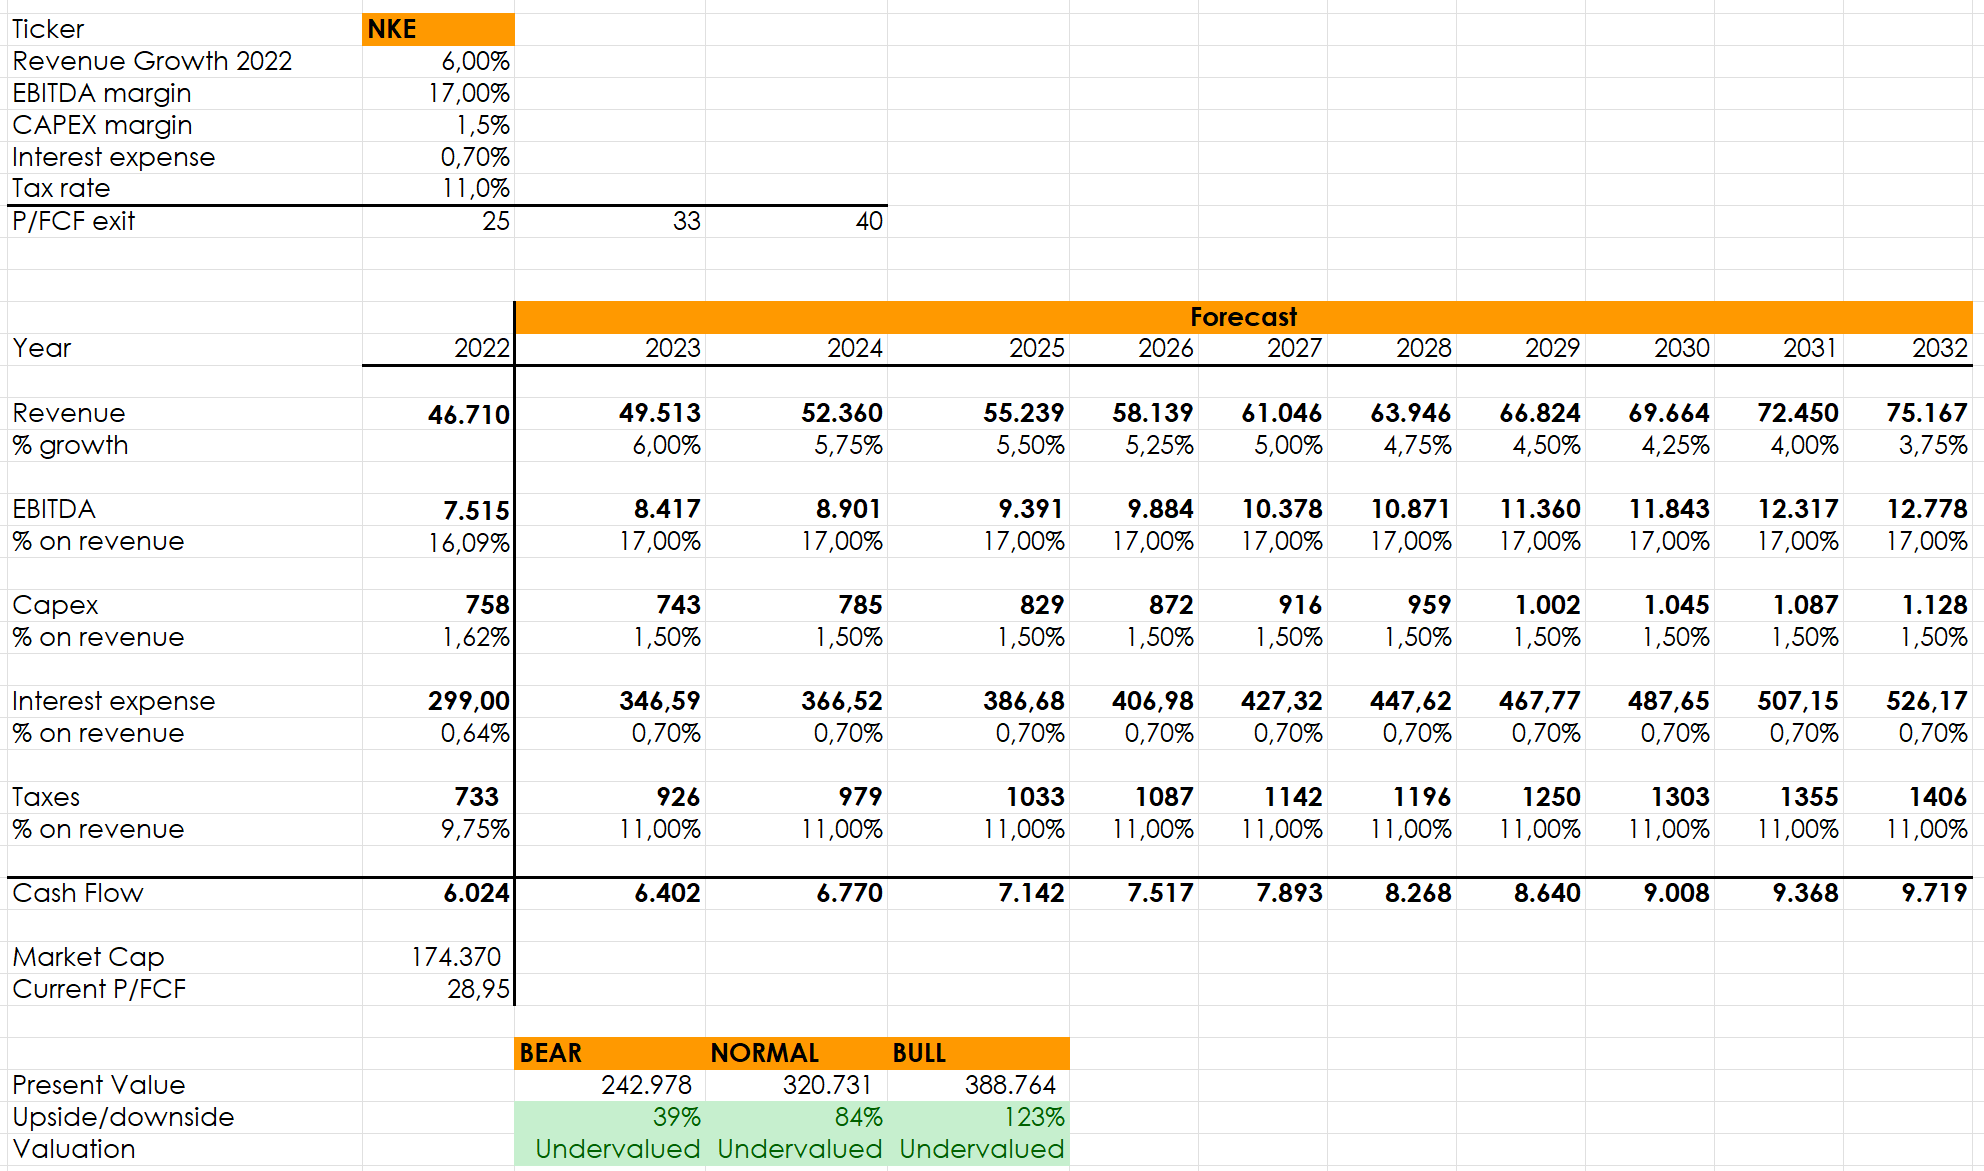
In any case, I think that for a stock like Nike it is important that investors hold it for a long period of time. It is the power of compounding that rewards greatly investors. But compounding needs time and not always it is immediately understood by investors. In this shaky and volatile market, I think Nike is among the best and safest picks I am buying for the long-term.