My REIT Strategy, In 2 Words: Overweight Great
NoDerog/iStock Unreleased via Getty Images
In my book, I explain:
“On a long-term, total-return basis, (real estate investment trusts) have been quite competitive with the S&P 500. But their investors should expect only moderate capital appreciation on an annual basis, consistent with moderate REIT cash flow and NAV growth.”
As such:
“There are two asset allocation questions that need to be answered here: How should REITs be weighted relative to other investments? And how should they be weighted relative to each other?”
My answer is:
“Based on both logic and historical precedent, I think most investors should find their REIT holdings fall somewhere in the 15%-20% range. That’s based on the supportable premise that these stocks can continue to deliver total returns equal to those of other asset classes with fairly low correlations to other asset classes that reduces portfolio volatility and may even increase overall investment returns.”
As for “intra-sector” weighting, don’t forget how many property and geographic subsectors exist. Or how much money you have to invest.
Or that REIT mutual funds and ETFs also exist.
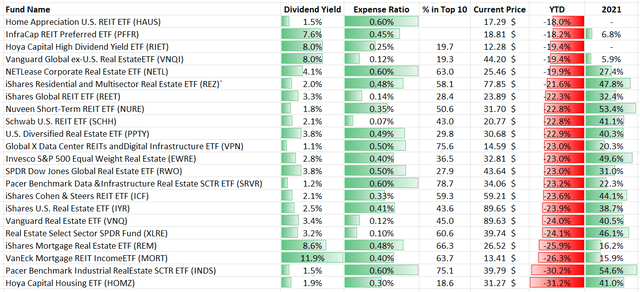
We track around 20 ETFs with total assets under management (‘AUM’) of around $100 billion. The largest is the Vanguard Real Estate Index Fund (VNQ), with AUM of $80 billion.
That’s more than 12 times its nearest competitor, Schwab U.S. REIT ETF (SCHH), with around $6.4 billion.
Considering the current market, let’s discuss seven mega-cap REIT ETFs and seven “specialty” examples.
The Good, the Bad, and the Ugly
Let’s start with the billion-dollar plus REIT ETFs. Along with VNQ and SCHH, we have:
- iShares U.S. Real Estate ETF (IYR)
- Real Estate Select Sector SPDR ETF (XLRE)
- iShares Global REIT ETF (REET)
- iShares Cohen & Steers REIT ETF (ICF)
- SPDR DJ Wilshire Global Real Estate ETF (RWO)
Each offers a different strategy, from the least-diversified XLRE to the most diversified RWO.
(Source: iREIT – FactSet, Yahoo Finance, Filings)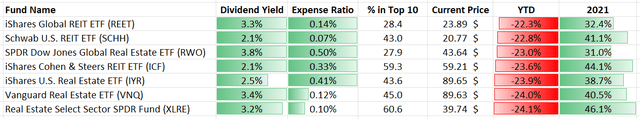
What’s interesting is that many of these larger mega-billion-dollar ETFs have some of the same constituents. They’re just weighted differently.
(Source: iREIT – FactSet, Yahoo Finance, Filings)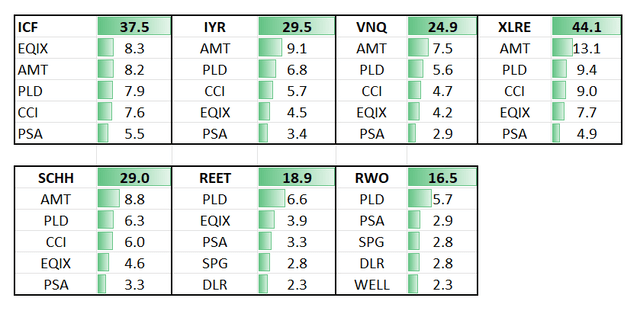
Take VNQ. As shown above, its largest constituents are:
I find it interesting that IFC, IYR, XLRE, and SCHH have those exact REITs in their top-five mix.
XLRE has the most top-10 concentration at 63.7%. And in 2021, it was the top-performer of these five ETFs.
That makes sense considering how it also has outsized exposure to AMT, PLD, CCI, and PSA – all REITs that did very well last year. As for 2022, these bigger-cap REITs have returned an average of negative 23% so far.
Putting the REIT Sharpshooters Into Perspective
Let’s move on to the eight REIT ETF “sharpshooters” that are differentiated by design. These include:
- Hoya Capital Housing ETF (HOMZ)
- Hoya Capital High Dividend Yield ETF (RIET)
- The Pacer Data & Infrastructure ETF (SRVR)
- U.S. Diversified Real Estate ETF (PPTY)
- Fundamental Income NETLease Corporate Real Estate ETF (NETL)
- Pacer Benchmark Industrial Real Estate (INDS)
- Home Appreciation U.S. REIT ETF (HAUS)
- iShares Residential and Multisector Real Estate (REZ)
(Source: iREIT – FactSet, Yahoo Finance, Filings)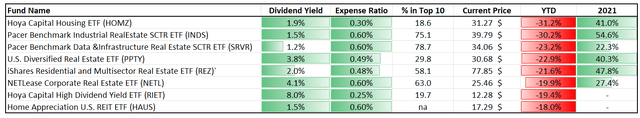
As you can see above, they all offer investors unique targeted strategies. I won’t go into a lot of detail here, but they’re generally smaller in size (less than $100 million in AUM).
The outlier in this is SRVR. According to Pacer Custom ETF Series, that offering provides “investors exposure to global developed market companies that generate the majority of their revenue from real estate operations in the data and infrastructure sector.”
Top STVR names include:
- Equinix – 15.6%
- American Tower – 15.1%
- Crown Castle – 14.7%
- SBA Communications (SBAC) – 4.6%
- Lamar Advertising (LAMR) – 4.3%
- Digital Realty (DLR) – 4.3%
In contrast, PPTY focuses on property sector weightings. Its top holdings include:
- AvalonBay (AVB) – 4.0%
- Prologis – 3.9%
- Equity Residential (EQR) – 3.2%
- American Homes 4 Rent (AMH) – 2.9%
- Equinix – 2.8%
- Terreno Realty (TRNO) – 2.5%
As viewed below, INDS – much like SRVR – has limited diversification, with 72.2% exposure from its top holdings:
- Duke Realty (DRE) 14.95%
- Prologis – 14.9%
- Americold (COLD) – 10.8%
- Life Storage (LSI) – 4.8%
- Innovative Industrial (IIPR) – 4.6%
- STAG Industrial (STAG) – 4.6%
I want to point out HOMZ in particular, which focuses on “diversified exposure across the entire United States residential housing industry.”
It “invests in 100 companies involved across the U.S. housing industry, including rental operators, homebuilders, home improvement companies, and real estate services and technology firms.”
While HOMZ was one of the top ETFs in 2021, it’s been the worst performer year-to-date. That’s thanks in large part to home building exposure (30%) – which includes single-family homebuilders and homebuilding products and materials.
REITs represent just around 30% of HOMZ’s weightings. So that’s an important consideration to know about.
Our REIT Strategy: Overweight Great
The term “diworsification” was first used by famed fund manager Peter Lynch in his book, One Up on Wall Street. It’s since evolved to mean inefficient portfolio diversification – which is something worth talking about.
Let’s face it…
Regardless of whether you invest in an ETF or you’re a do-it-yourself (DIY) investor, you want to generate great results. I know I don’t want any part of the good, the bad, and the ugly. I just want greatness.
To be honest, that’s why I usually don’t invest in ETFs. While some investors may prefer the various strategies identified above – and I understand why – the only way I see to create real wealth is to invest in the highest-quality individual REITs that are trading at significant discounts to their intrinsic value.
Accordingly, it’s earnings that will drive the best shareholder returns over time, not simply by owning any old portfolio. That’s especially true these days, as inflation skyrockets, rates climb…
And shares in REITs drop by around 20%, making for very attractive entry points.
Today, I’d like to highlight two dominating REITs that could serve as core positions in your REIT portfolio. These aren’t just good REITs to own.
They’re all great!
Great REIT #1
Realty Income (O) owns more than 11,000 net-lease properties in the U.S. and Europe. As such, it shouldn’t surprise you that one thing that separates this company from its peers is its diversification benefits.
This helped it navigate the black swan event that was the 2020 shutdowns. During the pandemic, when most all theaters and gyms closed down – of which O owns several – it was able to generate positive adjusted funds from operations (AFFO) per-share growth.
(Fast Graphs)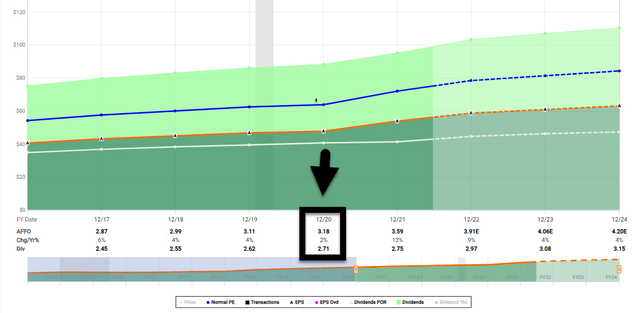
In fact, O has generated positive earnings growth in 25 of 26 years, while delivering 5.1% annual growth since 1996. The REIT average is 4%.
This scale advantage has allowed it to scale even further by entering the European market – where it now has more than $5 billion of investments.
Another factor driving O’s quality score is its balance sheet. The REIT is rated A3/A-, with outstanding credit metrics that include:
- 5.4x net debt to earnings before interest, taxes, depreciation, and amortization for real estate (EBITDAre)
- 5.6x fixed charge coverage
- 93% unsecured debt
- 27% debt to market cap
In short, its highly disciplined risk-management practices is why so many retail investors flock to the name. Usually, that is.
Realty Income Continued…
One would think that after obtaining an A-rating, entering Europe, and integrating the Vereit portfolio into its own, that O would be trading at a premium valuation, right?
(Fast Graphs)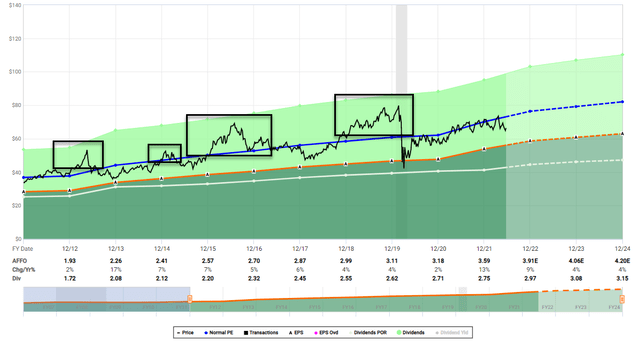
Nope.
O is now trading at a 17.7x compared to its five-year average of 20x. In addition, O’s dividend yield these days is 4.5%. And that comes with a much better payout ratio after the Vereit integration and office spinoff of Orion (ONL).
As viewed below, O’s payout ratio (based on AFFO) is 74.5%, which is the lowest it’s been in years.
(REIT BASE)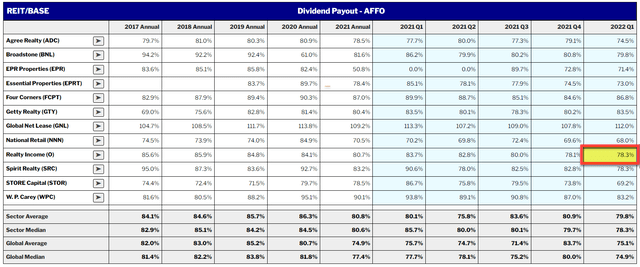
Analysts are forecasting O to grow earnings by 9% in 2022 and 4% in 2023. And that doesn’t include another large merger and acquisition (M&A) deal – which we believe is likely in the net-lease sector.
Also, given O’s outsized exposure to investment-grade-rated tenants, we see little recession-related risk in 2023.
As viewed below, we target Realty Income to return about 20% over the next 12 months.
(Fast Graphs)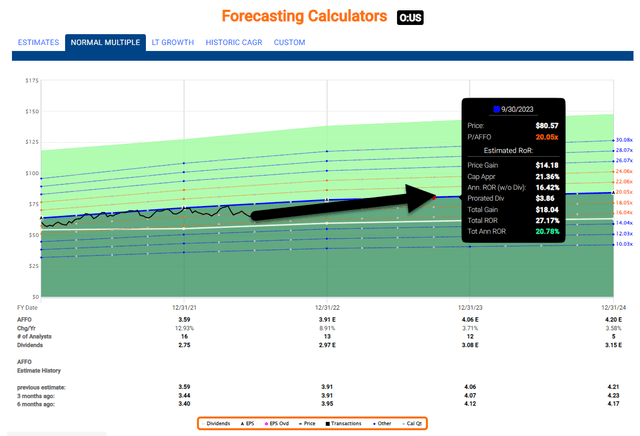
Great REIT #2
Boston Properties (BXP) is an office REIT that owns 202 properties at just under 54 million square feet in:
- Boston
- New York
- San Francisco
- Los Angeles
- Seattle
- Washington, D.C.
One key differentiator for BXP vs. its office peers is the overall quality of its portfolio.
As management pointed out on the Q1 earnings call:
“The best buildings are getting more than their proportionate share of market demand. Despite these headwinds on demand and supply, the BXP portfolio had its third consecutive sequential strong leasing quarter.”
In Q1, BXP showed an occupancy gain of 40 basis points. And it picked up another 30 bps in Q2.
The company signed leases on more than 975,000 square feet of to-be-commenced space for its in-service portfolio. That’s up from 925,000 square feet in Q4-21.
Another key differentiator for BXP is its life-science exposure, which now stands at approximately 4.6 million square feet. There’s an additional 5 million square feet of future development potential too.
Furthermore, the development returns are a healthy 9% based on proforma estimates.
While BXP saw a modest earnings (i.e., AFFO per share) decline in 2020, it’s clawed back nicely. We’re talking about up 4% in 2021 and, based on analyst estimates, up 20% in 2022.
(Fast Graphs)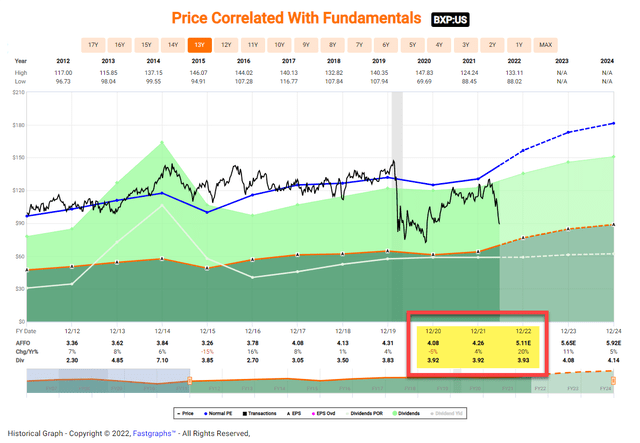
Boston Properties Continued…
Another key differentiator for BXP is its best balance sheet in the office sector at BBB+. It also has excellent access to capital to minimize debt costs and maximize profitable investments going forward.
Conservative balance sheet metrics include 7.5x net debt to EBITDAre, 3.3x fixed-charge coverage, and a 36% debt to market cap. Plus, as of Q1-22, BXP has $1.7 billion of liquidity comprised of $500 million in cash and $1.2 billion on its revolving credit facility.
Once again, BXP screens cheap with a p/AFFO of 19.1x vs. the five-year average of 30.5x. And its 4.4% dividend yield is well-covered by AFFO, as shown below:
(Reit Base)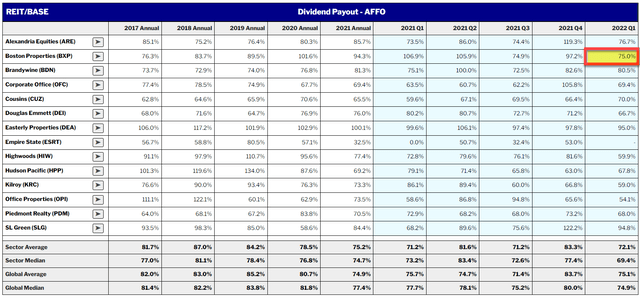
In Q1-22, BXP reported a beat largely driven by higher parking and lower general and administrative costs (G&A). As such, it raised 2022 guidance by $0.075 (1.0%) at the midpoint to $7.45. If correct, this would mean 13.5% year-over-year growth.
At quarter’s end, BXP’s portfolio was 89.1% leased, up 30 bps from Q4-21.
As viewed below, iREIT is forecasting BXP to return in excess of 25% over the next 12 months.
(Fast Graphs)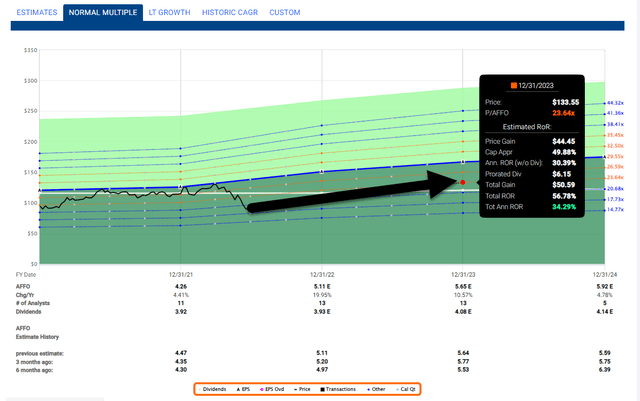
In Conclusion…
At Seeking Alpha, we believe the very best way to avoid “sucker yields,” “value traps,” and general indigestion is this…
Always focus on quality first.
By carefully screening for the best-in-breed stocks using fundamental analysis, investors can easily beat the market. By a long shot.
These days, there are many excellent REITs you can purchase without chasing yield. In fact, I’m personally doubling my exposure to the sector now.
My goal to retirement can move closer to reality that way. And I would love to see all you here on Seeking Alpha to retire rich with REITs as well.
(iREIT on Alpha)