LRT Capital Management June 2022 Investor Update
courtneyk
Dear Friends & Partners,
Our investment returns are summarized in the table below:
|
Strategy |
Month |
YTD |
12 Months |
24 Months |
Inception |
|
LRT Economic Moat |
+5.36% |
-29.54% |
-19.10% |
+7.02% |
+21.12% |
Results as of 6/30/2022. Periods longer than one year are annualized. All results are net of all fees and expenses. Past returns are no guarantee of future results. Please contact us if you would like to receive a full performance tear sheet. Please see the end of this letter for additional disclosures.
|
Investment Terms and Service Providers |
|
|
Investment Structures: |
Delaware LP |
|
BVI Professional Company |
|
|
Management Fee: |
1% |
|
Performance Fee: |
20% |
|
High Water Mark: |
Yes |
|
Lockup: |
None |
|
Minimum Investment: |
$1,000,000 |
|
Redemption: |
Monthly, 30-day notice |
|
Auditor: |
EisnerAmper LLP |
|
Prime Brokers: |
IBKR |
|
Custodian: |
IBKR |
|
Fund Administrator: |
NAV Consulting |
|
Legal Counsel: |
Winston & Strawn LLP |
|
O’Neal Webster (BVI) |
|
|
Compliance: |
IQ-EQ (Blue River Partners) |
June’s results were excellent, with strong positive returns overall vs. sharp declines for market indexes. Our strong results were driven primarily by our hedges, with our portfolio companies declining much less than the market as a whole. I believe that this month marks a turning point for the market, with high- quality, growth companies finally returning to strong performance as the “stagflation” trade begins to fade. As of July 1st, 2022, our net exposure was approximately 77.74%, and our beta- adjusted exposure was 50.7%. We currently have 57 long positions with the top 10 accounting for approximately 40.7% of our total long exposure.
Last month, I wrote that our current portfolio is full of “coiled springs” – I still expect a positive year from our portfolio overall despite the disappointing performance year-to-date. While I believe our strategy has a bright future and I am confident in my ability to outperform the market over the next few quarters, the past six months have been more volatile than I imagined or hoped for.
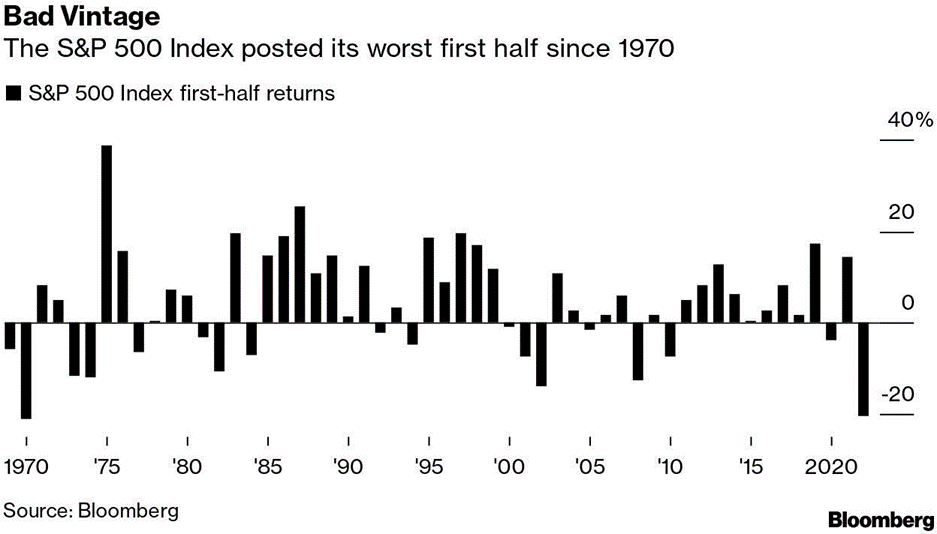
As unhappy as I am about the results of the past six months, they are ultimately short-term results and will not matter much in the long-term. It is also important to look at the environment that we have been in. While this is no excuse, the market itself just experienced the worst first half in over fifty years. One must go back to 1970 to find an equally bad beginning to the year.
Inflation
When thinking about the stock market it is always important to ignore the current state of the economy and rather focus on what the economy might look like in 9 to 12 months from now. What is likely to determine the directions of stocks over the short-term (the next 6 months), is the outlook for inflation and interest rates over the coming year.
It is entirely plausible for the U.S. economy to do relatively badly over the next several months while the stock market rips higher. The current macro-environment is extremely unusual, in that we are experiencing very large swings in what economist refer to as “private inventories”, which are the goods available for sale at all levels. I believe these swings can be explained by the bullwhip effect,1 currently occurring in many industries with long lead times and global supply chains, due to the unprecedented disruptions brought about by Covid.2 It is important to note that inventory changes affect the calculation of GDP and were positively contributing to GDP in 2021 and are contributing negatively right now. As a result, it is very likely that the U.S. may be in a technical recession as I write these words. After all, Q1 GDP was negative,3 and Q2 GDP estimates from the Atlanta Federal Reserve are currently at -2.1%.4 Yet, if we are in a recession right now, this may be one of the strangest recessions on record: a recession at full employment, low jobless claims, and a strong housing market. In Austin, where I live, many restaurants continue to operate with curtailed hours due to a shortage of staff.
Over the past two years, huge amounts of new money were created out of thin air by central banks. What is upsetting is that despite all this new money creation, we don’t have an economy that has significantly more capacity to produce commodities, manufacturing capacity, dramatically better infrastructure, or a more highly educated workforce. Instead, the money went into asset markets such as stocks, real estate, and cryptocurrency, driving up their values. Don’t get me started on SPACs.5 We are now living with the aftermath and the hangover from this bonfire of vanities. As liquidity has declined so have asset prices. While many speculative companies have further to fall, high-quality companies have seen their prices affected as well, presenting an opportunity for discerning investors who understand how to value companies based on their long-term competitive advantages. The opportunity set for investors focused on high-quality companies is currently the biggest it has been in many years.
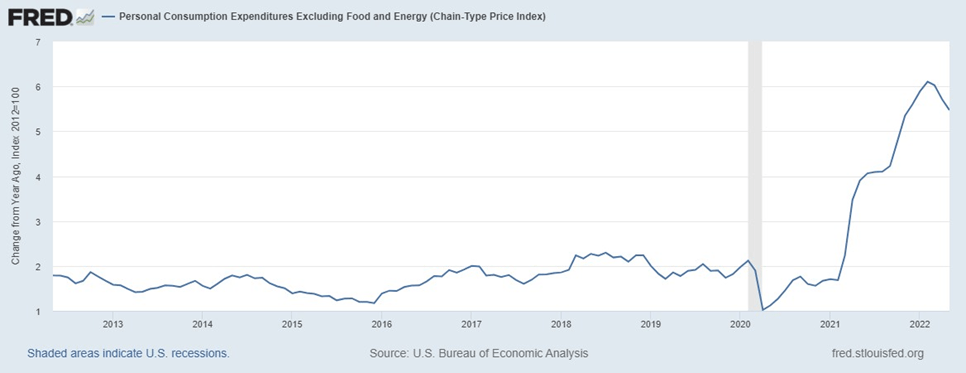
Inflation in the United States may be peaking and is likely to soon roll-over. The Federal Reserve’s most commonly cited inflation index, Core PCE (which is a backward-looking indicator) has been declining for several months now although it remains stubbornly high in absolute terms.
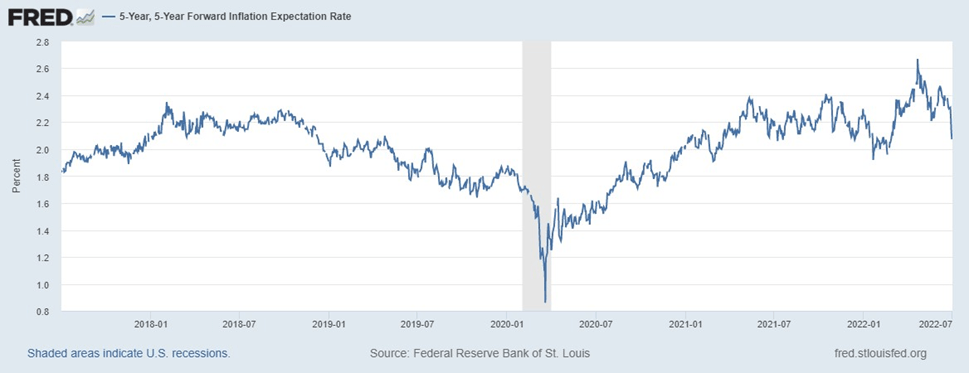
Similarly, market-based measures of inflation expectations (5-Year, 5-Year Forward Inflation Expectations for example), have been declining for several weeks now. In fact, as of this writing, Fed Funds Futures, market-based expectations of the future short term interest rate are pricing in a peak rate of 3.25% sometime in early 2023, and 75bps of interest rate cuts over the course of 2023, with the first of these expected rate cuts likely in about 9-10 months from now. These expectations have shifted significantly during June, as new economic data has indicated that the economy was slowing rapidly.
What’s more, prices for ocean freight shipping from China to the U.S. have been declining all year and are about to turn negative YoY. Similarly, the prices of wheat, corn, oil, fertilizer, natural gas, and many other commodities have fallen sharply during the month, indicating that the supply shortages we have been experiencing over the past six months are easing. All of this adds up to an inflation rate that is likely to ease significantly in the months ahead. To be clear: inflation is likely to remain uncomfortably high over the next few months, even though it will likely decline from the record 8.6% recorded in June.
Central bankers are likely to continue to talk tough on inflation, and politicians will continue to sound concerned. But markets are not interested in the here-and-now, but rather the outlook a year ahead. As the market narrative likely shifts towards a discussion of future rate cuts and not hikes, I expect growth-oriented companies, many which are down 50% or more over the past few months, to generate superior returns going forward. In this environment, I expect our strategy to perform much better than it has in recent months.
Our Portfolio
The top ten investments in our portfolio as of 7/1/2022, in order of position size, are presented on the following pages. All valuation metrics and returns are as of 7/1/2022 unless otherwise stated.
The table below gives additional insight into our portfolio exposure. We continue to be dramatically underexposed in technology, communication, financials, and utilities, while being overexposed in industrials, consumer cyclicals and real estate. These sector weightings are an outcome of where we currently see opportunities, and not a top-down decision based on macro predictions. We will happily own many technology companies if their valuations become more attractive.
|
Portfolio Statistics as of 7/1/20226 |
|||
|
Sector Allocations (Long Exposure, %) |
|||
|
S&P 500 Sector |
Portfolio |
S&P 500 |
Delta |
|
Consumer Cyclical |
26.14 |
11.84 |
14.30 |
|
Industrials |
23.96 |
8.15 |
15.81 |
|
Technology |
9.93 |
25.59 |
(15.66) |
|
Healthcare |
8.83 |
13.70 |
(4.87) |
|
Financial Services |
7.85 |
13.19 |
(5.34) |
|
Real Estate |
6.47 |
2.72 |
3.75 |
|
Consumer Defensive |
4.77 |
6.50 |
(1.73) |
|
Basic Materials |
4.66 |
2.34 |
2.32 |
|
Energy |
3.92 |
3.87 |
0.05 |
|
Communication Services |
3.47 |
9.36 |
(5.89) |
|
Utilities |
– |
2.74 |
(2.74) |
|
Market Cap Allocations (%) |
|||
|
Large |
35.61 |
||
|
Mid |
51.7 |
||
|
Small |
12.7 |
||
|
Country Allocations (%) |
|||
|
United States |
94.86 |
||
|
Canada |
3.76 |
||
|
Denmark |
1.38 |
||
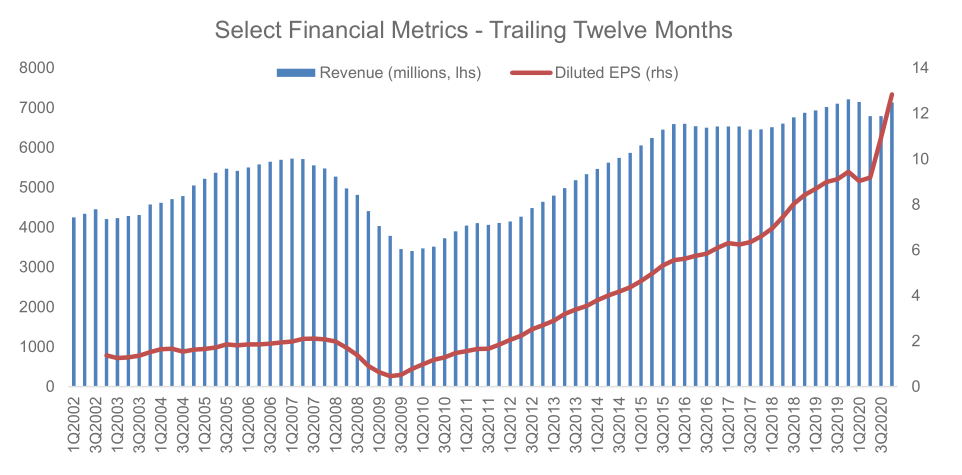
#1 – Northrop Grumman Corporation (NOC)
Based in Virginia, Northrop Grumman is one of the world’s largest defense contractors with annual revenue more than $30 billion. The company operates in a cozy oligopoly, that after decades of consolidation the US defense market is now controlled by five large companies: The Boeing Company (BA), General Dynamics Corporation (GD), Lockheed Martin Corporation (LMT), Northrop Grumman Corporation (NOC), and Raytheon Technologies Corporation (RTX).
Industry barriers to entry are immense, government procurement cycles are extremely long, and the consolidated industry structure reflects this. This industry structure has allowed Northrop to earn stable mid-teens returns on invested capital (ROIC) and grow earnings per share at a rate of over 13% per year in the past decade, despite a topline that has grown only in-line with inflation. Even after the recent run-up in the stock price, it trades at approximate 15x, next year’s earnings estimates, far below the S&P 500 index, despite being an above average company. While nominally, there are five major defense contractors, the true industry concentration is even higher because not all companies compete in all possible business segments. General Dynamics’ division submarine division, Electric Boat, is the sole supplier of nuclear power submarines in the United States. Lockheed Martin is the sole supplier of the F-35 and F-22. Northrop was the sole bidder on the contract to develop the next generation of intercontinental ballistic missiles; and so on.
The company’s revenue growth over the past decade has been mediocre but even that has led to impressive shareholder returns that have far outpaced the S&P500. What’s more, we believe that revenue growth may accelerate in the next few years. A lot of ink spilled every year about the “massive” U.S. defense budget7 that critics claim is “out of control”8. Given this, you might be surprised to hear that U.S. defense spending as a share of GDP is at the lowest level in recorded history,9 at a mere 3.8%. In other words, U.S. military spending could double and not be out of line with historical norms. While we are not calling for a new Cold War, given the global instability we are witnessing, it is not unreasonable to expect defense spending to grow faster than GDP over the next decade.
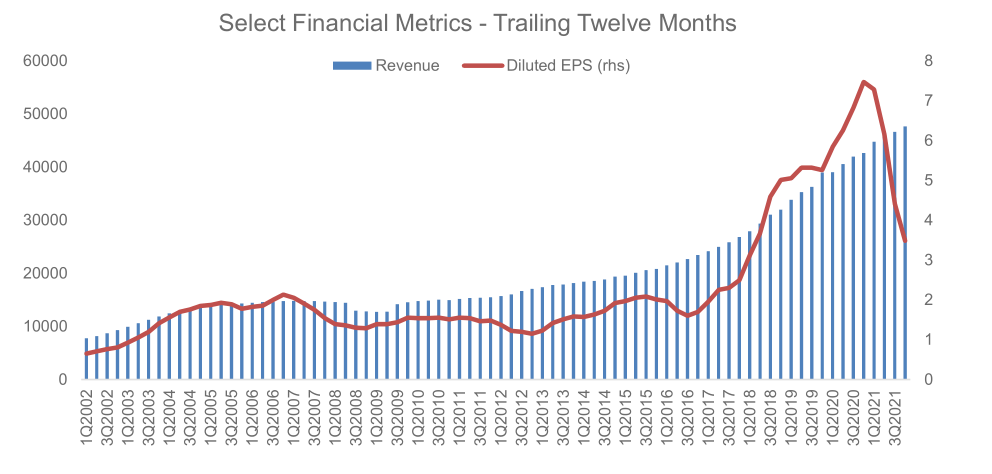
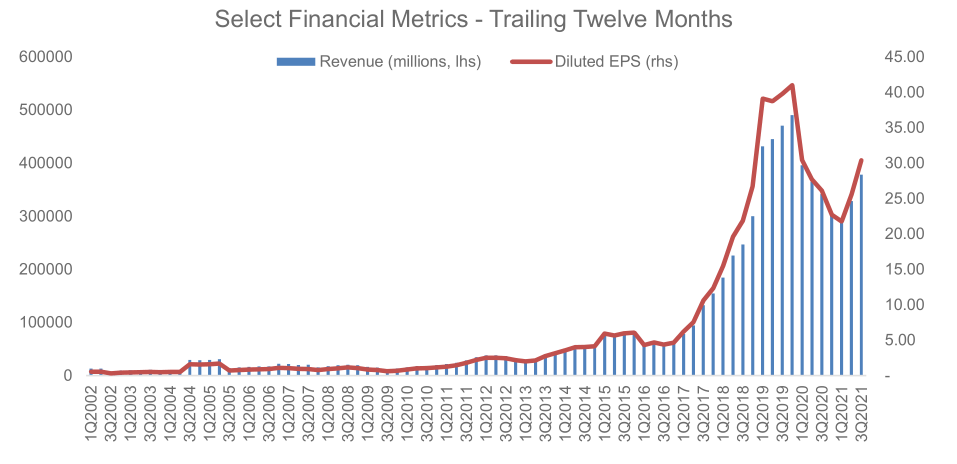
#2 – Marriott International, Inc. (MAR)
Marriott is the world’s largest hotel company followed closely by Hilton (HLT) and Intercontinental Hotels Group plc (IHG). The company owns a portfolio of brands from the low end (Courtyard, SpringHill Suites, Aloft), through the mid-tier (Marriott, Sheraton, Westin, Renaissance Hotels), to the luxury high end (JW Marriot, Ritz-Carlton, St. Regis). In total the company had 7,642 properties with over 1.4 million rooms as of the end of Q1 2021.10
The majority (85%) of Marriott’s revenue comes from hotels in the United States, with the rest almost evenly split between Asia Pacific and Europe. Like it’s smaller peer, Hilton, the company today is almost exclusively a manager and franchisor of hotels, not a hotel owner. The company owns 66 hotels, manages 2,083 and franchises 5,493. Like all franchise-based businesses Marriott requires very little capital to grow as it utilizes the investment capital of its hotel-owners/partners to expand. Marriott currently faces a difficult operating environment due to the Covid-19 pandemic and uncertainty about the future of business travel. However, the company is an excellent operator with a somewhat leveraged capital structure (the company acquired Starwood Properties in late 2016) – if pent-up demand for travel materializes post-Covid, as we expect it will, the company will quickly go from losing money to raking in profits.
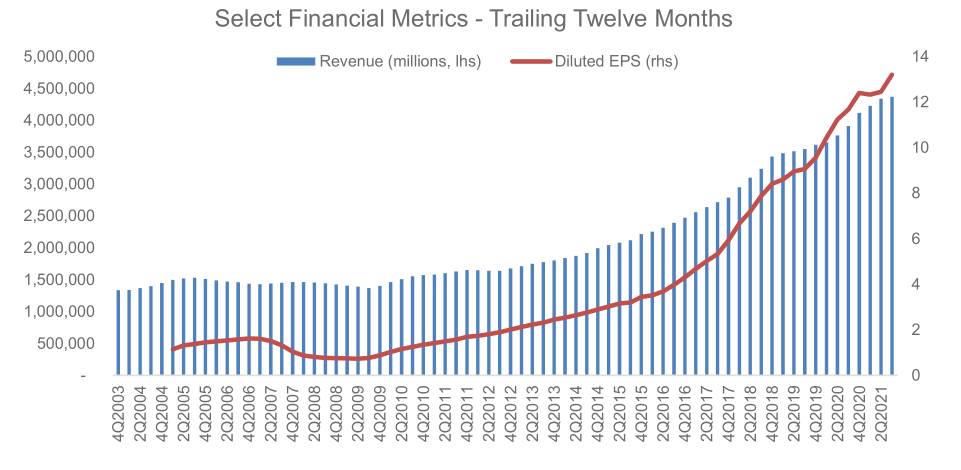
#3 – Domino’s Pizza, Inc. (DPZ)
Domino’s Pizza is the world’s largest franchisor of pizza restaurants with over 13,800 locations in 85 countries. As for any restaurant operator, the key metric to consider for Domino’s Pizza is same-store-sales (SSS) growth. Growing same-store-sales are ultimately how a restaurant business increases earnings from its existing assets. The company continues to impress in this criterion with SSS having grown in the U.S. for 40 consecutive quarters, and an astounding 109 straight quarters internationally.
Two-thirds of the company’s stores are currently abroad, and the international segment remains the company’s largest growth opportunity, as the penetration of convenient fast food remains lower abroad than in the United States. Pizza is a product with exceptionally high gross margins, one that “translates” well across different cultures, and one that literally “travels well”, not losing much of its appeal when delivered in a cardboard box. The rise of 3rd party delivery platforms such as Uber Eats, Doordash (DASH) and Grubhub is challenging the pizza category as it has expanded the number of choices consumers have for convenient takeout. However, the economics of food delivery remain challenging for most restaurants and platforms alike11, while pizza delivery continues to be highly profitable. Regardless of how the “delivery wars” currently playing out end, Domino’s financial results show little impact of this increased competition, and the company continues to deliver exceptional financial performance.
Domino’s Pizza stock is not optically cheap based on forward earnings, however, the company has routinely reported earnings growth of over 20% in almost all quarters since 2009. Given the company’s high growth rate, international growth opportunities, and capital light business model, which allows for returns on invested capital of over 40%, we are happy to continue to hold the shares.
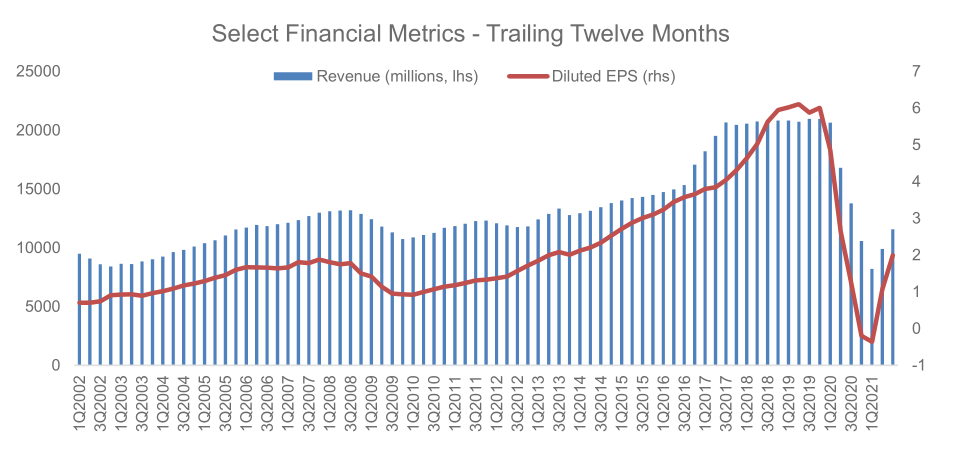
#4 – Progressive Corp. (PGR)
Progressive is a leading U.S. auto insurer that has pioneered telemetrics as a source of differentiation in its underwriting and it operates through a direct (non-agency) sales model. We believe that the company’s sales model, which is still the minority model in the industry confers on the company a durable process-based cost advantage that has allowed the company to deliver industry leading combined ratios (a standard measure of profitability in the insurance industry).
The company has plenty of room to grow and take market share from players such as State Farm (STFGX), Farmers and Nationwide. The cost advantages conferred by the direct sales model are unstoppable, and the scale advantages the company has in advertising and other customer acquisition costs furthers its strong competitive position. We believe the industry structure is going to evolve towards a duopoly with Progressive and GEICO as the two main players.
While we do not believe telemetrics itself confers any competitive advantage as it is a technology that has been copied by other players, Progressive is a very innovative company, and it has evolved from being an insurer for the highest risk drivers to one that now targets the general population. GEICO on the other hand began its life as an insurer for the best drivers and has now evolved in the direction of insuring everyone. On the surface the companies are similar, but their different pasts continue to shape their corporate cultures and are evident in subtle ways in their decision-making processes arounds expense management and claims processing.
The company has a very conservative investment portfolio with over $44 billion in fixed income securities.12 75% of their portfolio is held in securities with a duration of under five years, which means that an increase in interest rates will benefit the company as the portfolio will relatively rapidly reprice into higher yielding securities.
#5 – Asbury Automotive Group, Inc. (ABG)
Asbury Automotive Group is one of the largest automotive retailers in the United States. It operates 90 dealerships consisting of 112 franchises and 25 collision repair centers. The company’s stores offer new and used vehicles, parts, and service, as well as finance and insurance (F&I) products. Franchise agreements controlled by automotive manufactures and state laws create an environment of tightly controlled market entry and restricted competition.
The dealership industry is highly fragmented with 93.5% of dealers having only between 1-5 locations according to data from 202013. In fact, dealers with over 50 locations account for only 0.1% of the industry – a testament to the huge opportunity for consolidation that lies ahead. Industry dynamics, including the rising complexity of automobiles and the need for omnichannel distribution are favoring better capitalized and larger dealer groups. We believe Asbury Automotive Group has several distinct advantages, particularly its highly profitable parts and service business, its overexposure to the luxury vehicle business, which carriers the best margins, and its Clicklane omnichannel strategy. Asbury’s management has also been acting in the best interests of its shareholders by allocating capital towards acquiring dealerships to aggressively expand its business, and occasionally repurchasing stock when attractive acquisitions targets could not be found.
ABG is not a fast-growing SaaS business, but when paying a valuation of ¼ of the overall stock market, one does not need to make heroic assumptions about the future to enjoy strong returns as shareholders. We believe that over the next several years, Asbury will continue to acquire dealerships, occasionally buy back stock and invest to improve its digital shopping experience. We wrote about Asbury in detail in our August 2021 Investor Letter.14
#6 – Texas Pacific Land Trust (TPL)
Long time readers will know that we rarely invest in commodity businesses. However, there are periods in the market where commodity-based businesses outperform the broad indexes by a wide margin. Therefore, to have balance in the portfolio, we have long searched for a competitively advantaged company in the commodity space. We believe that Texas Pacific Land Trust (TPL), meets that criterion. Formed out of assets of formerly bankrupt railroads, TPL controls the largest acreage of land in the Permian basin – the center of the US shale oil industry.
The company has two main sources of income:
- royalties from oil & gas extracted on its properties – essentially a free call option on future oil prices and production; and
- a water business which develops water resources and sells services to the fracking industry.
We see TPL as an effective way to diversify the portfolio into a commodity exposed business that has a history of smart capital allocation and low risk of financial distress during periods of low oil prices. The company has no debt, and $281 million in cash.15
The company uses most of its cash flows to pay dividends and repurchase shares.
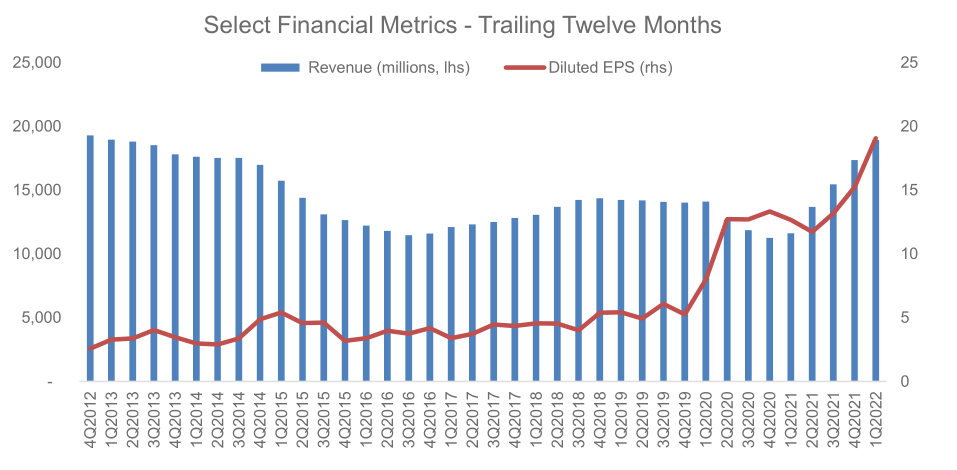
#7 – Murphy USA Inc. (MUSA)
We have held a position in Murphy USA for several months and have recently increased it, making it a top ten name in the portfolio. The company is a gas station operator and was spun-off from Murphy Oil in 2013. Murphy USA operates 1,700 stores primarily in Walmart parking lot locations and owns the underlying real-estate.
What makes Murphy USA unique from other convenience store operators such as Casey’s General Stores, Inc. (CASY) and Alimentation Couche-Tard Inc. (OTCPK:ANCTF)16, is the company’s focus on high volumes of gasoline sales17 and a minimal amount of convenience store sales. Fuel sales account for close to 60% of gross profit, a big difference from a typical convenience store, where fuel is close to 25% of profits. Most locations have a very small store of approximately 500 sqft only.
In December 2020, Murphy USA purchased QuickChek, a chain of 157 stations in the New Jersey and New York with an average store size of 5,500 sqft. which will strengthen the company’s food offering and expand the company’s focus into larger store formats.
The industry Murphy USA operates is attractive because of rising fixed costs of operations which are squeezing smaller and less well capitalized players leading to industry consolidation. While the advent of electric cars may mean less gasoline sales in the future, we continue to believe that the transition to electric vehicles will take a lot longer than most analysts believe.
The company has been using all available cashflow to repurchase shares, a value creating activity, as we view the shares as undervalued.
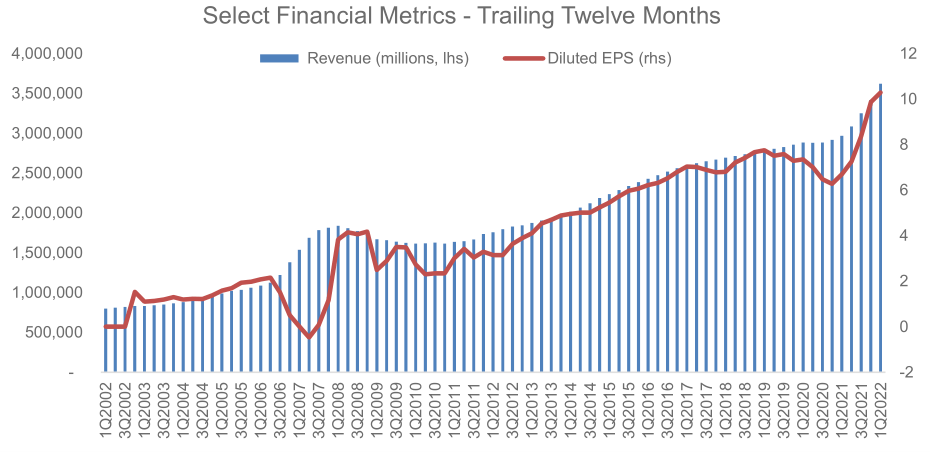
#8 – Public Storage (PSA)
Public Storage is the largest self-storage REITs. The company acquires and develops self-storage facilities and currently owns or manages over 2,7000 properties and is extremely well diversified across the United States. The company was founded in 1972 and IPO-ed in 1980. We have long admired the company’s ability to grow and maintain high occupancy. We purchased our position after a recent pullback in the company’s share price. We also hold a small position in Extra Space Storage Inc. (EXR), for the same reasons.
The business is largely recession proof with predictable revenues that grow every year due to rent increases, operating efficiencies and new sites. Typical reasons for using a self-storage facility include deaths, divorces, downsizing as well as birth and marriages – things that happen all the time, regardless of the economy. The company can continue to grow through consolidation as the self-storage market is still dominated by mom-n-pop operators. By acquiring underperforming assets and improving operations the company creates incremental shareholder value.
In densely populated areas land is scarce and land values are high. High value locations are limited in major metropolitan areas and cannot easily be acquired by an incumbent. This is a simple and seemingly boring business that takes decades to build and that cannot be disrupted by tech companies.
We wrote about Public Storage in detail in our March 2022 letter.18
#9 – Booking Holdings Inc. (BKNG)
Booking Holdings was formerly Priceline.com but has changed its name to reflect that source of most of its revenue: Booking.com. Booking.com is the largest online travel agency (OTA) in the world, connecting travelers and hotels. The company has over 2.3 million properties in 220 countries on its site, along with photos, reviews and details about the amenities offered by each property. The accommodations offered range from hotels, motels, homes & apartments, hostels, and bed & breakfasts. The company occupies a dominant position in the travel booking funnel and collects revenue from hotel reservations booked through its site. Booking.com is particularly strong in Europe, where chain hotels are less dominant and smaller independent hotel rely on it to fill their rooms.
In addition to Booking.com, the company owns agoda.com, priceline.com, rentalcars.com, OpenTable and the KAYAK flight search engine. Hotel bookings account for most of the revenue, but the company also offers car rental reservations, flights, vacation packages, cruises, tours, airport taxis, etc.
The company benefits from economies of scale in its investments in technology, national advertising, and customer loyalty programs. The business also has enormous network effects, as consumers are most likely to use a booking platform with the most properties, broadest availability of reviews and strong customer service. This in turn drives hotels to make their room inventory available on booking.com, which drives most of the reservation traffic for many boutique hotels, thus reinforces the network effect. Of note, is that Booking.com operates two models: the agency model, where the company simply acts as an agent for a hotel and collects a fee, and the merchant model, under which Booking.com buys the room-night from the hotel, but then retains the ability to optimize the pricing on the room.
Also of note is the fact that the acquisition of Booking.com by Priceline.com is amongst the most successful and value creating M&A transactions of all time.
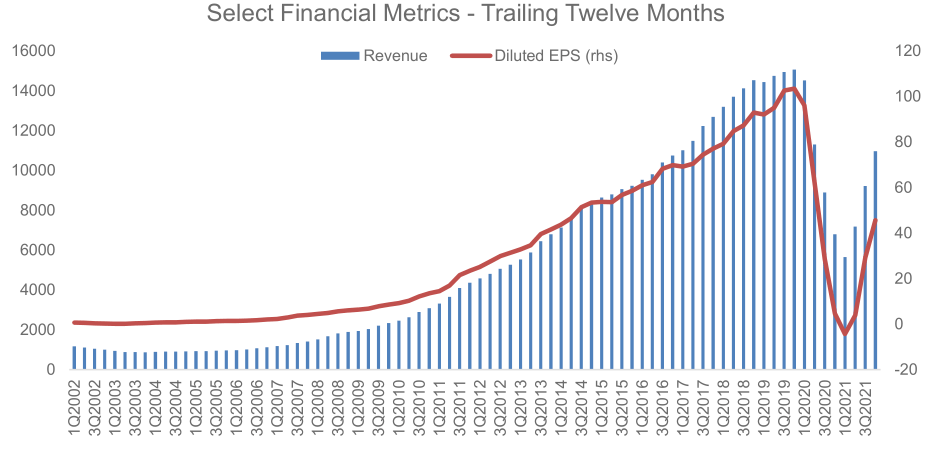
#10 – AO Smith Corp. (AOS)
A.O. Smith is the largest US manufacturer of residential and commercial water heaters, boilers and water treatment products. The company generates close to $3 billion in annual sales. The majority of the company’s business (73%) is done in North America, with the balance coming from China and India. Approximately 80% of demand is replacing existing heaters and 20% is tied to new construction. The company continues to benefit from a shift towards higher efficiency, but more expensive, tankless heaters.
A.O. Smith generates returns on invested capital in the high teens. The company uses its earnings to consistently grow its dividends and share repurchases. Over the past three years the company’s performance has been hurt by its exposure to China as its business there suffered due to the US-China trade war and poor execution. We believe the China business is back on track and the all-important US business is doing better than ever as housing demand heats up in the US. The company beat earnings estimates over the past several quarters and is currently enjoying very good performance as the hot U.S housing market continues to be strong.19 A.O. Smith also recently increased its share repurchase authorization.
As always, I look forward to hearing from you and answering any questions you might have.
Thank you for your continued interest and support.
Lukasz Tomicki
Portfolio Manager, LRT Capital
Appendix I: Attributions and Holdings as of 6/1/2022
|
LRT Economic Moat |
Portfolio Statistics |
|||||
|
Top Holdings (%) |
Sector Allocations (Long Exposure) |
|||||
|
Northrop Grumman Corporation (NOC) |
5.07 |
Sector |
Portfolio |
S&P 500 |
Delta |
|
|
Domino’s Pizza, Inc. (DPZ) |
4.89 |
Consumer Cyclical |
27.17 |
10.73 |
16.44 |
|
|
Marriott International, Inc. (MAR) |
4.63 |
Industrials |
26.83 |
8.22 |
18.61 |
|
|
Deere & Company (DE) |
4.27 |
Technology |
11.48 |
24.46 |
(12.98) |
|
|
Booking Holdings Inc. (BKNG) |
4.08 |
Healthcare |
9.62 |
14.48 |
(4.86) |
|
|
Progressive Corp. (PGR) |
4.05 |
Financial Services |
7.49 |
13.37 |
(5.88) |
|
|
Asbury Automotive Group, Inc. (ABG) |
4.00 |
Real Estate |
7.25 |
2.77 |
4.48 |
|
|
Texas Pacific Land Trust (TPL) |
3.81 |
Consumer Defensive |
3.95 |
6.90 |
(2.95) |
|
|
Colliers International Group Inc. (CIGI) |
3.52 |
Energy |
3.81 |
4.80 |
(0.99) |
|
|
AO Smith Corp. (AOS) |
3.26 |
Communication Services |
2.42 |
8.81 |
(6.39) |
|
|
Top Holdings Total |
41.57 |
Utilities |
– |
2.98 |
(2.98) |
|
|
Basic Materials |
– |
2.47 |
(2.47) |
|||
|
Hedges (%) |
Market Cap Allocations (%) |
|||||
|
Vanguard Mid-Cap ETF (VO) |
-12.66 |
Large |
34.93 |
|||
|
Vanguard Small-Cap ETF (VB) |
-11.58 |
Mid |
53.87 |
|||
|
iShares Core S&P Mid-Cap (IJH) |
-11.30 |
Small |
11.2 |
|||
|
SPDR S&P MidCap 400 ETF (MDY) |
-11.30 |
|||||
|
iShares Russell 2000 (IWM) |
-10.88 |
|||||
|
iShares Core S&P Small-Cap (IJR) |
-10.71 |
|||||
|
Return Attribution (%) |
Country Allocations (%) |
|||||
|
Long Equity |
-2.74 |
United States |
92.43 |
|||
|
Hedges |
5.46 |
Canada |
5.53 |
|||
|
Unlevered Gross Return |
2.72 |
Denmark |
2.05 |
|||
|
Leveraged Gross Return |
5.44 |
|||||
|
Net Return |
5.36 |
|||||
Source: Morningstar, Sentieo.
Net returns are net of a hypothetical 1% annual management fee (charged quarterly) and 20% annual performance fee. Individual account results may vary due to the timing of investments and fee structure. Please consult your statements for exact results.
Please see the end of this letter for additional disclosures.
Appendix II: Investment Philosophy
Over the past 36 months, we saw a large increase in the number of LRT Capital partners (the term we use to describe our clients). With so many newcomers, it is important that we write about our investment philosophy again.
Here are the key points:
- Exceptional stock returns come from exceptional business returns on a per-share basis.
- We seek to invest in high-quality companies, i.e., those possessing sustainable competitive advantages (moats), the ability to grow and reinvest capital over time, and management that excels at capital allocation.
- We only purchase companies whose shares trade at a discount to our assessment of their intrinsic value.
- It is futile to predict short-term market movements. We seek to hold our investments for as long as possible.
- The financial markets are dominated by short-term traders who see stocks as casino chips. This occasionally allows us to purchase shares in great companies at large discounts to their true worth.
- If we are right about the trajectory of the businesses we invest in, over time, we will be right on the trajectory of their stock prices.
We view stock market volatility as a source of opportunity. Volatility allows us to profit by acquiring shares in superb businesses at attractive prices. The more that markets (the “other” participants) are irrational, the more likely we are to reach our ambitious performance objectives.
In the long run, stocks are the best investment asset class, but our experience has taught us that our investment process will not generate linear returns. In some years, our portfolio will outperform, and in others, it will generate a below average return. This is a certainty that we must accept. We are long-term investors and we do not try to dance in and out of the market.
In summary, our investment strategy can be summed up in three steps:
-
- Only seek out high-quality companies.
- Do not overpay.
- Do nothing – patience and discipline are the keystones to success.
Appendix III: Portfolio Construction Software Overview
LRT separates the discretionary and qualitative process of selecting the equity holdings from the portfolio construction process which is systematic and quantitative.
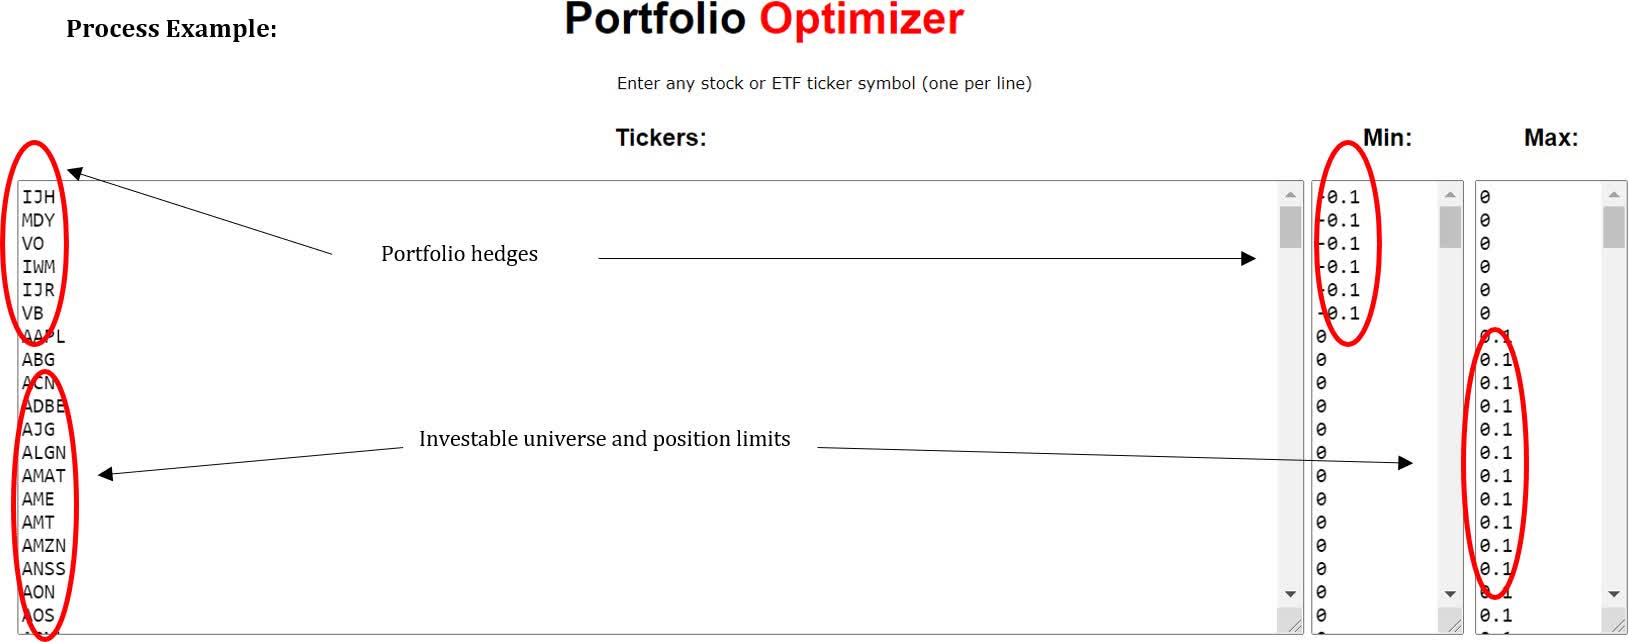
Our quantitative process considers each position’s contribution to portfolio volatility, contribution of idiosyncratic vs. systematic risk and portfolio factor (size, value, quality, momentum, vol, etc.) exposures.
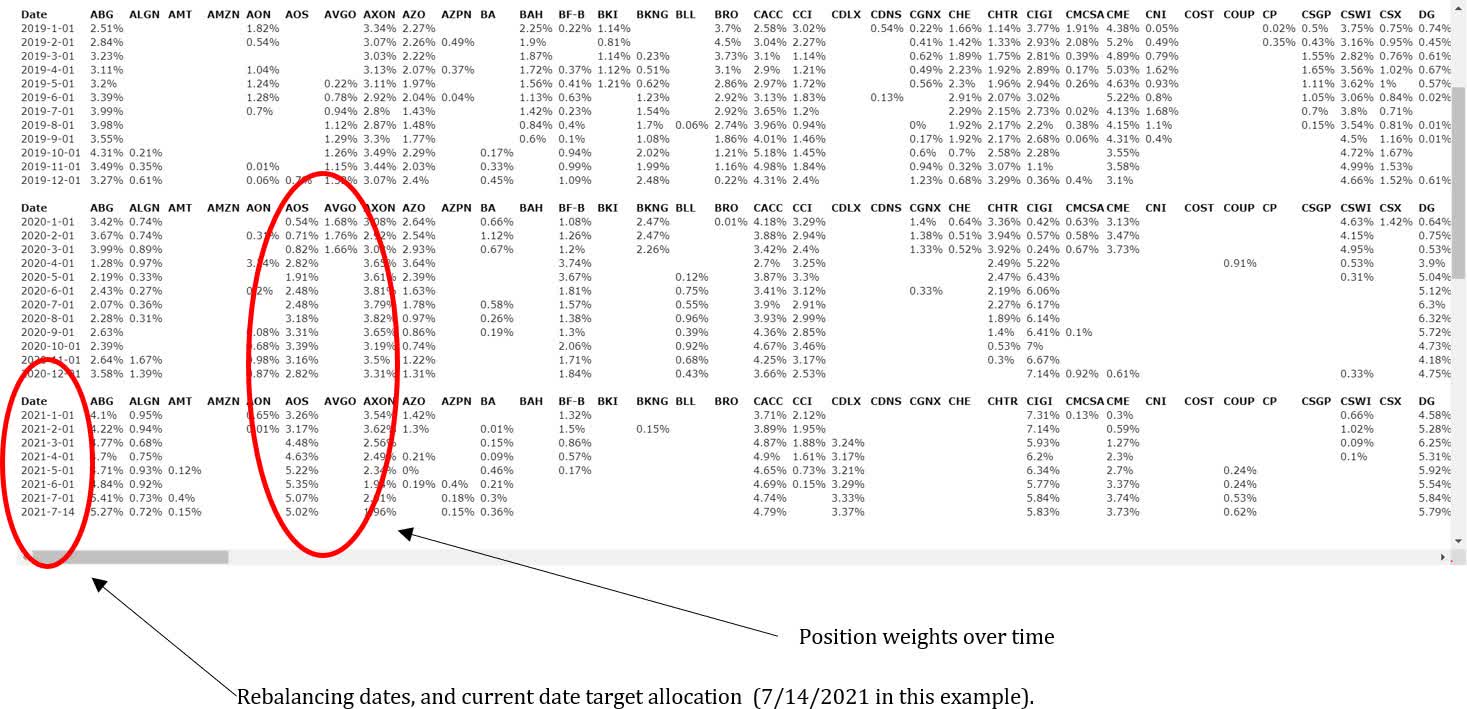
The system outputs target portfolio weighs for each position. We trade mechanically to rebalance the portfolio each month to the targeted exposures. This eliminates emotions, human biases, and overconfidence risk.
Example system output:
1 https://www.youtube.com/watch?v=fNUmEw2EJPs&ab_channel=InvestorTradingAcademy
2 https://leanfactories.com/beer-game-how-the-bullwhip-effect-in-supply-chains-happens/
3 https://www.bea.gov/news/2022/gross-domestic-product-third-estimate-gdp-industry-and-corporate-profits-revised- first#:~:text=Real%20gross%20domestic%20product%20(GDP,real%20GDP%20increased%206.9%20percent.
4 https://www.atlantafed.org/cqer/research/gdpnow
5 “Spac boom dies as wary investors retreat”, Financial Times, June 8, 2022, https://www.ft.com/content/2a560343-69eb-4e36- 9833-cc579a7dc8ad
6 Source: Morningstar, Sentieo.
7 It’s Time to Rein in Inflated Military Budgets, https://www.scientificamerican.com/article/its-time-to-rein-in-inflated-military-budgets/
8 U.S. Military Spending is Out of Control, https://www.bloomberg.com/opinion/articles/2021-12-27/pentagon-budget-military- spending-is-getting-out-of-hand
9 https://fred.stlouisfed.org/series/A824RE1Q156NBEA#0
10 Source: Marriott, 10-K/A, 02-Apr-21
11 DoorDash lost $312 million in Q4, 2020. Source: DoorDash, 8-K Earnings, Update, 25-Feb-21
12 As of September 30th, 2021. Source: PGR 10-Q FY21 Q3.
13 https://www.nada.org/WorkArea/DownloadAsset.aspx?id=21474861098
14 https://www.lrtcapital.com/wp-content/uploads/2021/09/2021-08-August-Investor-Update.pdf
15 Source: TPL, Investor Presentation March 2021, 02-Mar-21
16 The owners of the Circle K brand.
17 The average Murphy USA store sells close to 3 million gallons of fuel per year, 75% more than the industry average.
18 https://www.lrtcapital.com/wp-content/uploads/2022/04/2022-03-March-Investor-Update.pdf
19 A. O. Smith surges on 3Q earnings beats; raises full-year outlook; https://seekingalpha.com/news/3760153-a-o-smith-surges-on- 3q-earnings-beats-raises-full-year-outlook
Editor’s Note: The summary bullets for this article were chosen by Seeking Alpha editors.