Fortuna Silver: A Solid Quarter With San Jose Uncertainty Removed (NYSE:FSM)
DarioGaona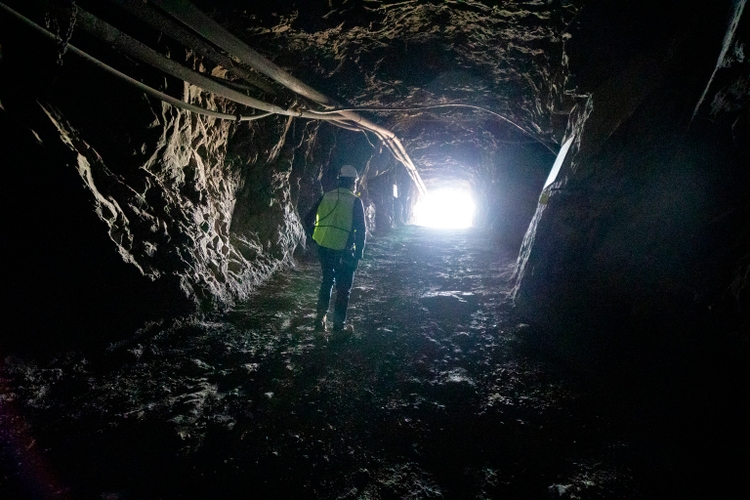
Just over three months ago, I wrote on Fortuna Silver (NYSE:FSM), noting that with the company finally lapping tough year-over-year comps and with Seguela in the wings, pullbacks below US$2.30 would offer buying opportunities. Since then, Fortuna has significantly outperformed the Gold Miners Index (GDX), up over 50% from this buy zone. This can be attributed to improving sentiment for the sector with the rebound in precious metals prices, the fact that the company remains on time/budget despite headwinds (inflation, supply chain), and the recent favorable ruling at San Jose in regards to the 12-year extension for its EIA. Let’s take a closer look at the Q3 results below:
Fortuna Silver Operations (Company Presentation)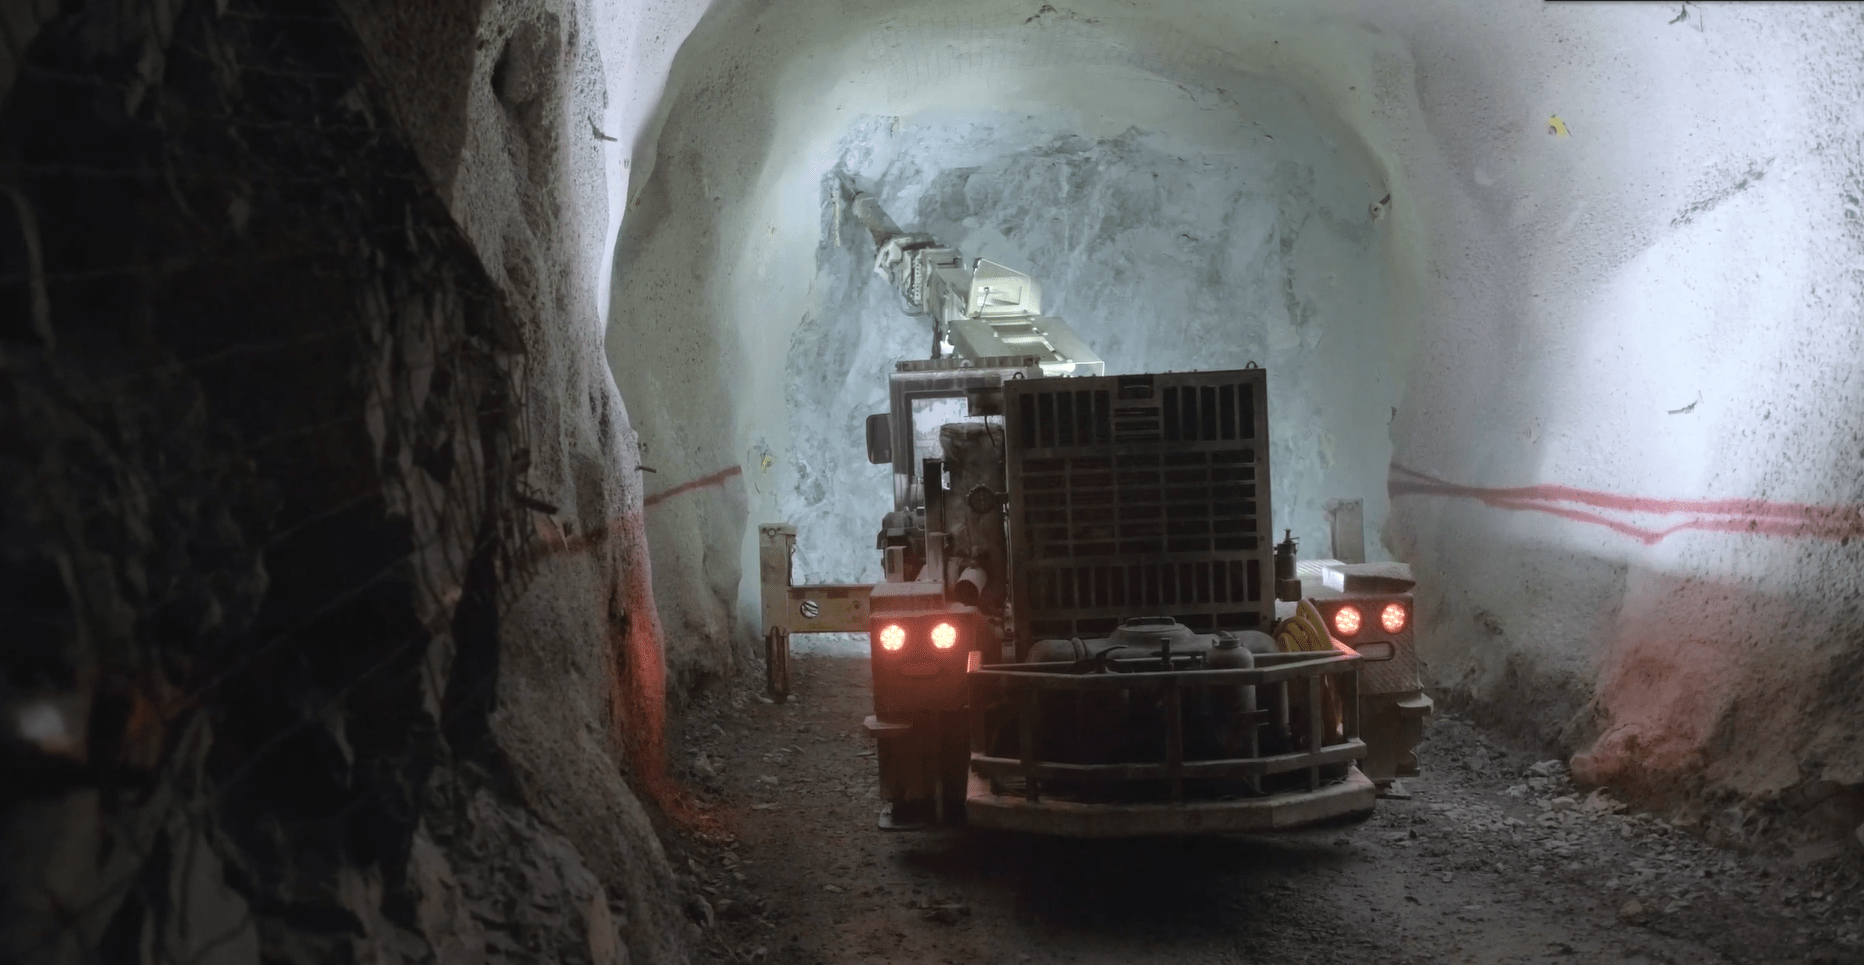
Q3 Production & Sales
Fortuna Silver Mines (“Fortuna”) released its Q3 results earlier this month, reporting quarterly production of ~66,300 ounces of gold and ~1.84 million ounces of silver with additional lead/zinc production, translating to ~68% of sales from gold in the quarter. This translated to a 1% increase in gold production and a 7% increase in silver production on a year-over-year basis. The increased output was helped by higher throughput at San Jose and grade outperformance at Lindero, in addition to the improved performance of the stacking/crushing circuits (delivered 100% of 1.37 million tonnes placed on pad in Q3). Lower grades at Yaramoko and much higher costs partially offset these positives.
Fortuna Silver – Quarterly Revenue (Company Filings, Author’s Chart)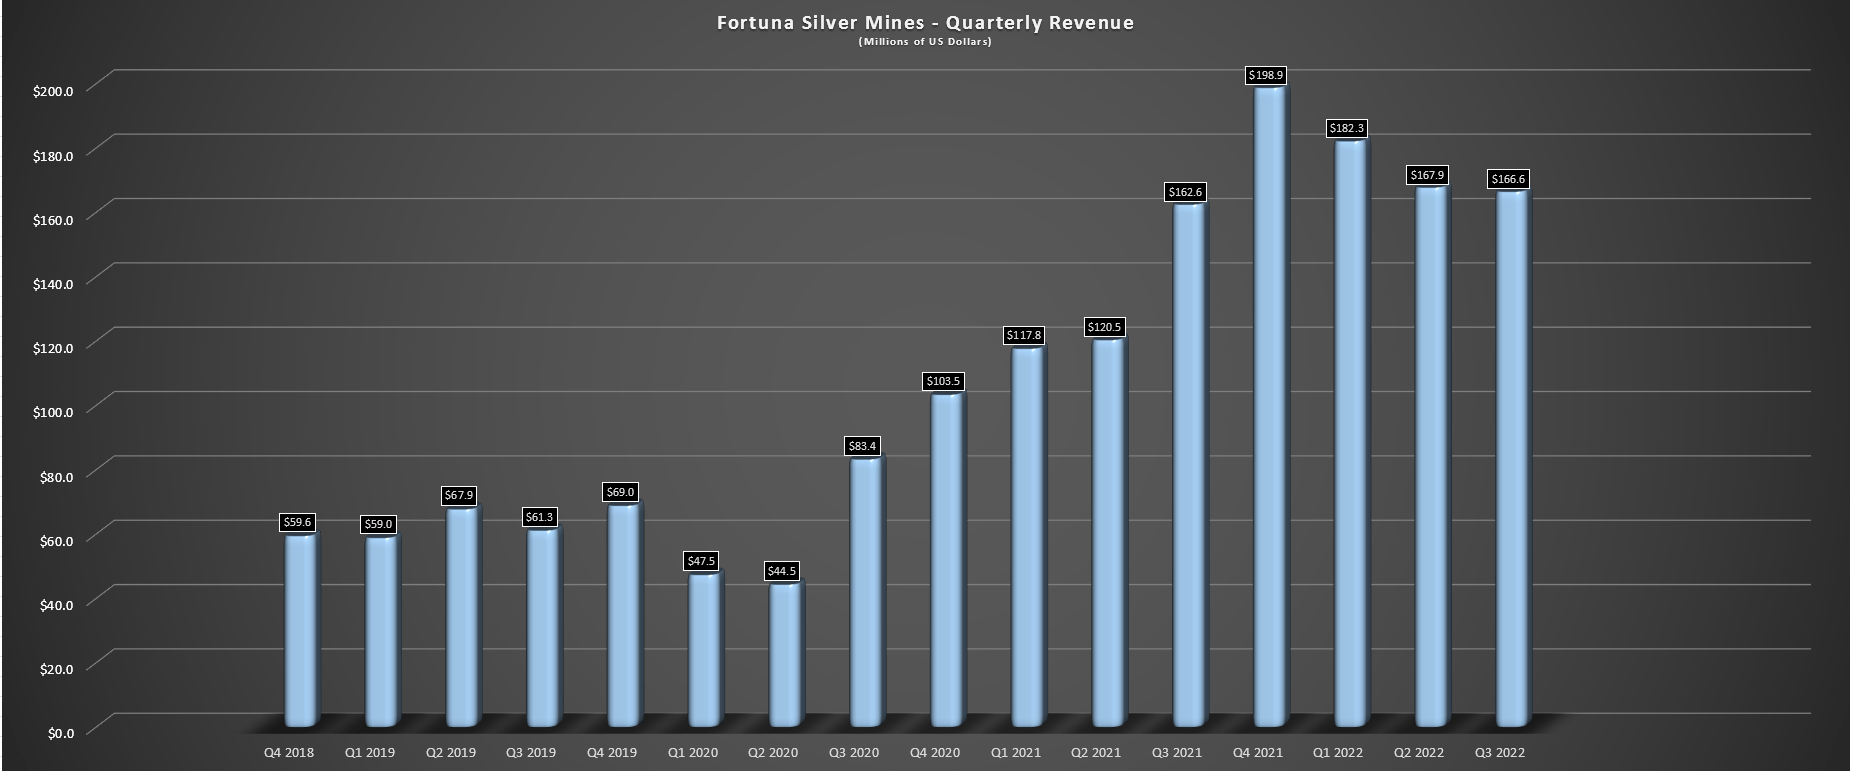
Unfortunately, the higher production didn’t make a significant difference from a sales standpoint. Fortuna reported revenue growth of just 2% in the period ($166.6 million vs. $162.6 million), with the increase in metal sales offset by a much weaker average realized silver price of $19.16, down 21% from the year-ago period. However, free cash flow generation was solid at $34.0 million (+17% year-over-year), helped by the strong performance at Lindero and despite increased sustaining capital expenditures in the period. The increase in sustaining capital expenditures was partially related to Yaramoko, with elevated sustaining capex due to higher mine development and equipment purchases related to the QV Prime Project ($10.3 million in Q3 2022).
Digging into the production results a little closer, Lindero saw a 15% increase in production year-over-year and enjoyed positive grade reconciliation with a 5%+ improvement in grades sampled vs. the reserve model – an encouraging development. Meanwhile, San Jose is tracking to meet the upper end of annual guidance, benefiting from a sharp increase in throughput year-over-year (~267,200 tonnes processed vs. ~249,000 tonnes processed) which offset lower gold grades. Finally, Caylloma also had a solid quarter, benefiting from higher lead and zinc recoveries, increased throughput, and a slight increase in silver grades/recoveries.
Yaramoko Quarterly Production (Company Filings, Author’s Chart)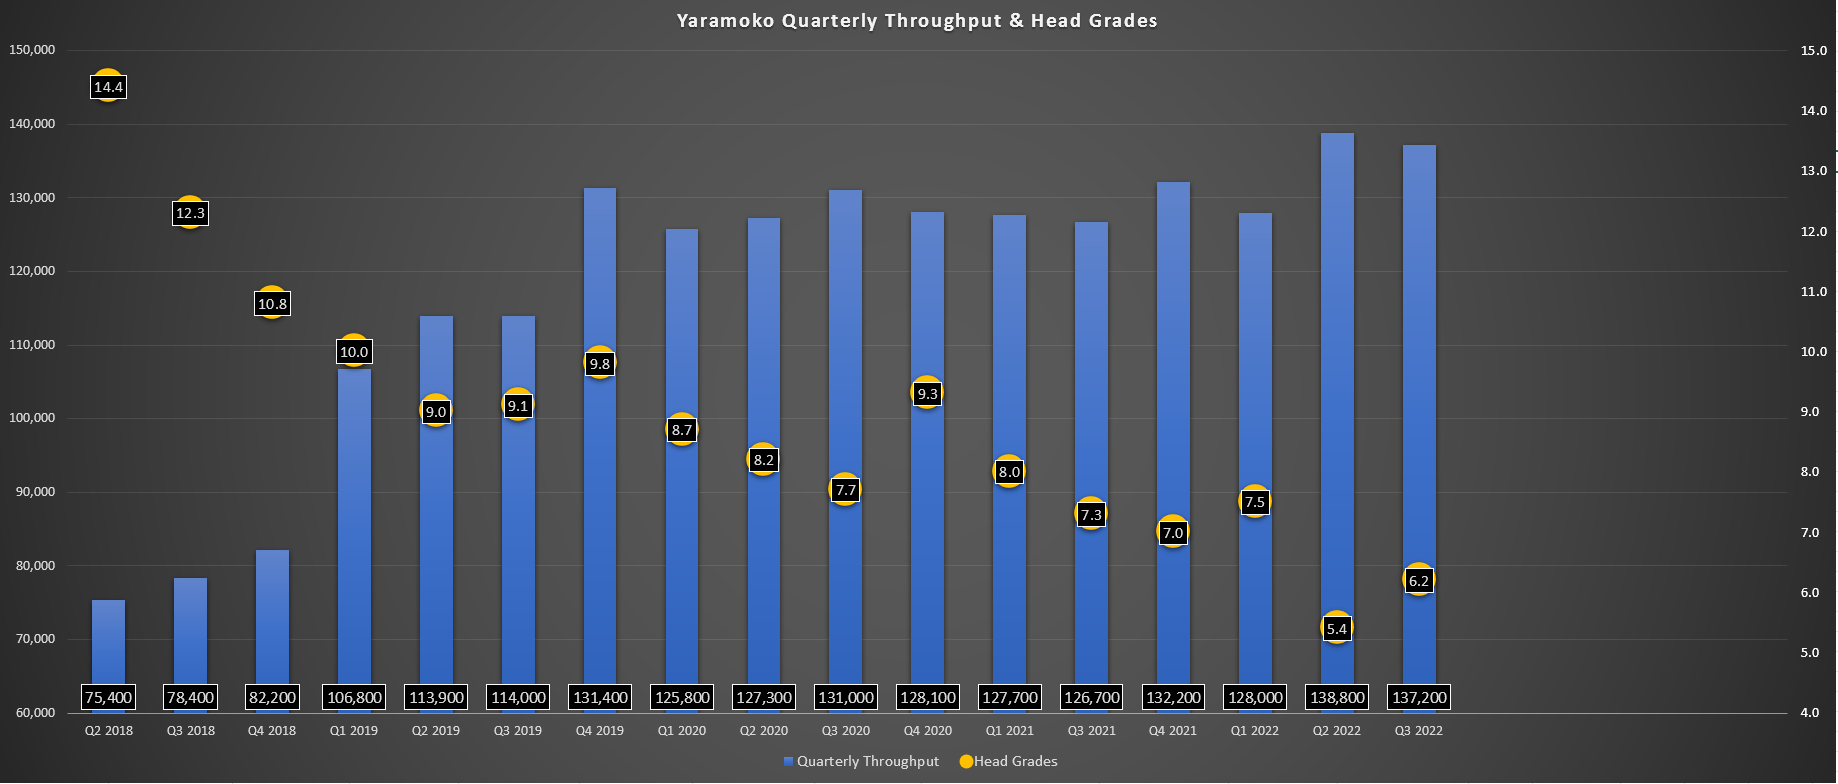
Unfortunately, this was offset by a softer quarter at Yaramoko, evidenced by a nearly 6% decline in gold production to ~27,100 ounces. This was related to much lower grades (6.21 grams per tonne of gold vs. 7.28 grams per tonne of gold) and lower recovery rates (97.0% vs. 98.0%). The company noted that it had to rely more on low-grade stockpiles to fill the mill due to being mine-constrained. Looking at the mine plan below, the asset’s future isn’t much brighter, with grades expected to drop further in 2023. Looking ahead to 2024 and 2025, grades will improve but will be more than offset by a sharp decline in tonnes milled, sending average production below 60,000 ounces per annum and keeping costs elevated.
Yaramoko Mine Plan (Technical Report)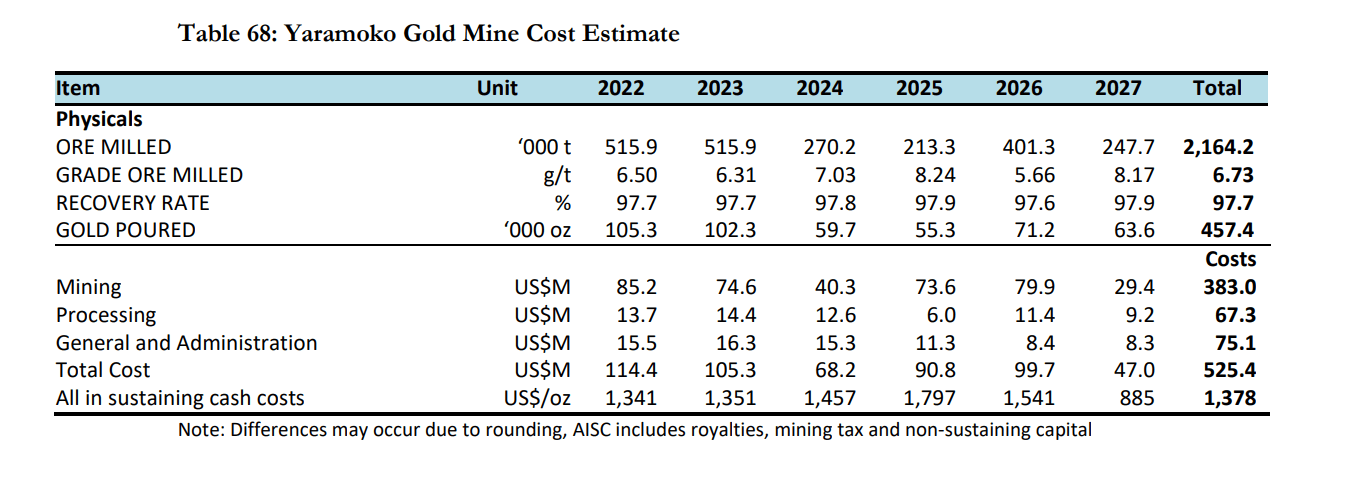
Finally, I’d be remiss not to note that the company’s high-grade Seguela Project remains on budget and schedule, is 83% complete, and major critical path items are completed, including the delivery of all components of the SAG Mill. Fortuna noted that connection to the national grid is expected to occur next month, and the plant connection is expected in January. Based on the Feasibility Study and incorporating some inflationary pressures, Seguela will significantly boost production at lower costs, with the production of ~133,000 ounces in the first six years at sub $900/oz all-in-sustaining costs [AISC]. However, this could ultimately be a ~160,000-ounce producer later this decade if the company can bring higher-grade deposits into the mine plan and increase throughput to ~1.60 million tonnes per annum.
Seguela Construction (Company Presentation)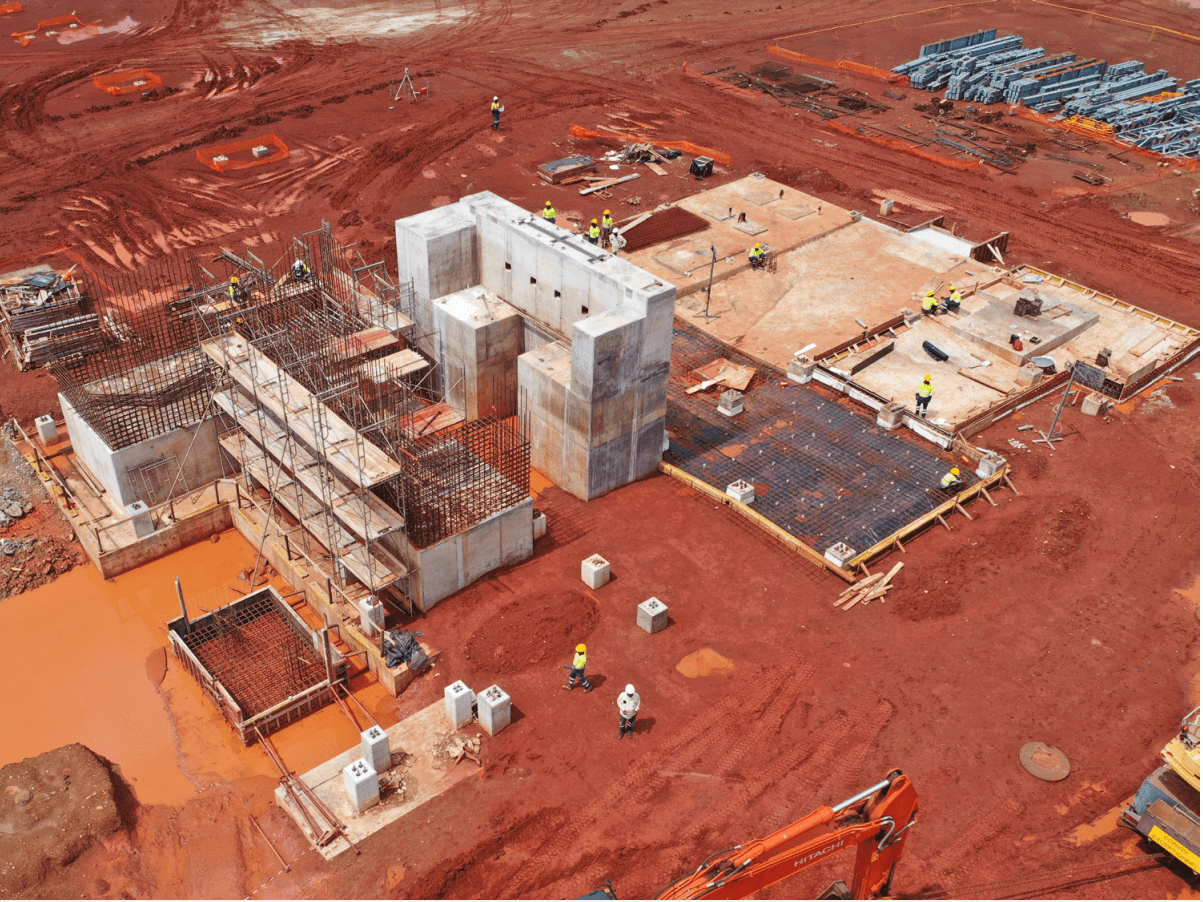
Costs & Margins
While the production performance year-to-date has been encouraging, with Fortuna on track to meet its guidance, costs have been tougher to control. This isn’t surprising, with its flagship operation being a high-volume and relatively low-grade operation (Lindero). The company also cited higher mining service costs at Yaramoko plus higher costs for key commodities across its operations, including diesel, steel, reagents, and explosives. The result was that costs were elevated at Yaramoko and Lindero vs. cost guidance, with Q3 AISC of $1,159/oz at Lindero ($1,117/oz year-to-date) and $1,630/oz at Yaramoko ($1,433/oz year-to-date), with Lindero’s costs above the top end of guidance on a year-to-date basis ($900/oz to $1,100/oz guidance).
Yaramoko & Lindero – All-in Sustaining Costs (Company Filings, Author’s Chart)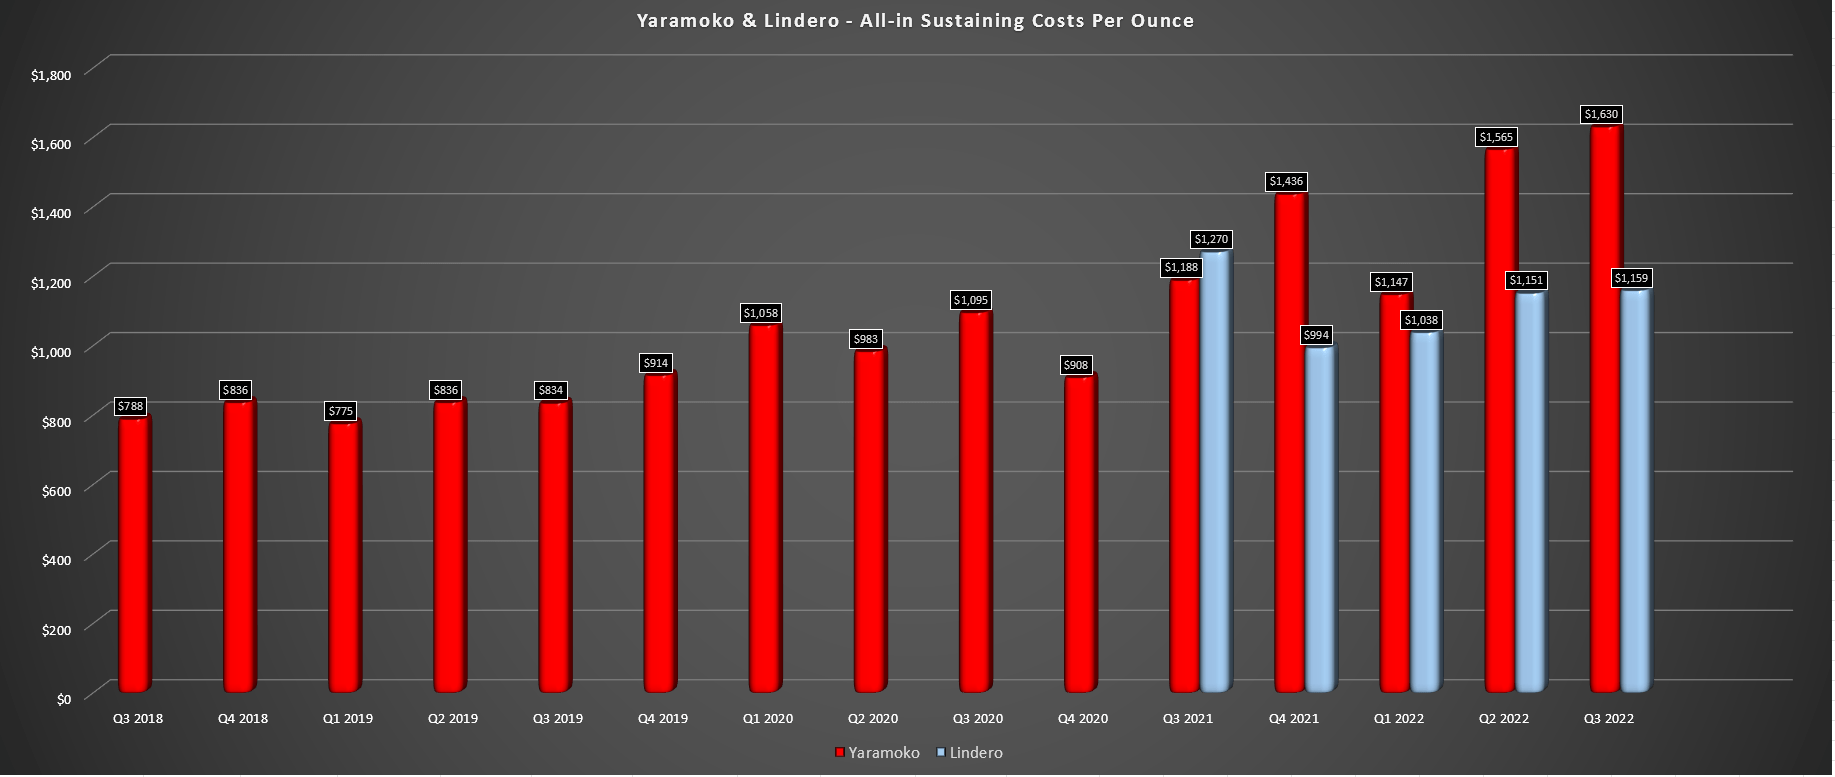
At the company’s silver operations, AISC was down on a year-over-year basis but increased on a per-tonne basis at both operations. However, this was offset by a much weaker silver price which put a severe dent in margins. In fact, silver-equivalent AISC margins at Caylloma fell to ~$3.50/oz, and San Jose’s silver-equivalent AISC margins dipped below $5.00/oz, a sharp decline from ~6.60/oz and ~$8.70/oz in the year-ago period. The good news is that silver appears to be trying to find its footing above the $20.00/oz level, suggesting that the trend in steady margin compression is behind the company for its silver business.
Looking ahead to FY2023, I wouldn’t expect much cost improvement at Yaramoko, but Seguela will pick up the slack, with commercial production likely to be reached in Q4 of 2023 with some contribution to consolidated costs. Meanwhile, the company’s silver business may not see much improvement in cash costs due to what’s been stickier than anticipated inflation. Still, it is benefiting from much easier year-over-year comps starting in H2-2022 (lower silver prices in H1-2021 making it easier to report margin expansion). So, with easier comps ahead, I would expect a decent year for Fortuna in 2023 as long as metals prices cooperate, especially with some contribution from Seguela.
Valuation & Technical Picture
Based on ~294 million fully diluted shares and a share price of US$3.65, Fortuna trades at a market cap of ~$1.07 billion and an enterprise value of $1.19 billion. This has left Fortuna trading at a slight premium to its estimated net asset value of $1.04 billion, which already incorporates exploration upside at Seguela and significant reserve growth at Sunbird. The result is that Fortuna is now trading at a much less attractive valuation than in August when I noted that the negativity was more than priced into the stock. In fact, based on what I believe is a generous P/NAV multiple of 0.95 to reflect Fortuna’s shrinking silver exposure and less favorable jurisdiction profile, I see a fair value for the stock of $988 million or US$3.36 per share.
Fortuna Silver August Article (Seeking Alpha Premium)
Some investors will argue that Fortuna should trade at a premium to net asset value, but I couldn’t disagree more with this point, especially when producers with lower costs, a much larger scale, superior diversification (8+ mines), and a stronger pipeline trade at lower valuations. One example is Endeavour Mining (OTCQX:EDVMF) which trades at less than 0.80x P/NAV as a ~1.5 million-ounce gold producer with one of the best pipelines sector-wide (multiple development projects in the wings). To summarize, I think the easy money has been made here on Fortuna, and I would view any rallies above US$4.00 before year-end as profit-taking opportunities.
FSM 1-Year Chart (TC2000.com)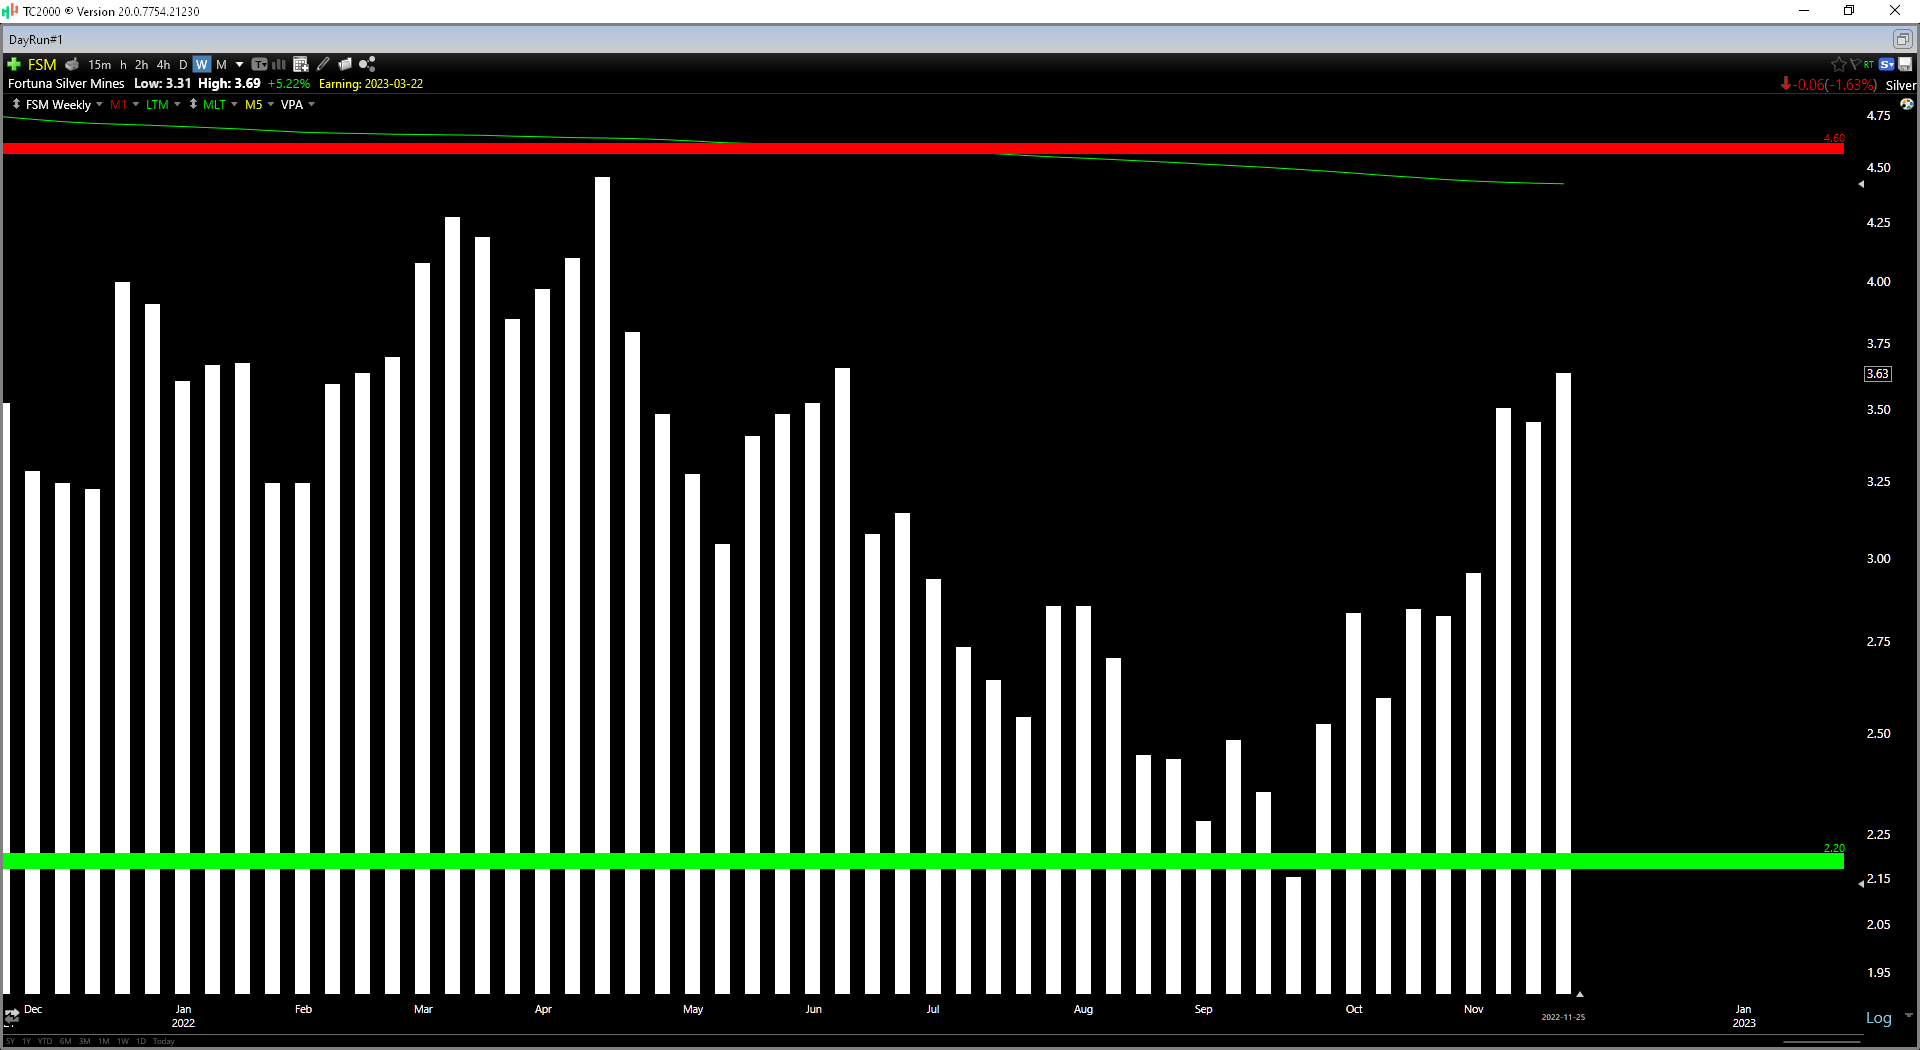
Looking at the stock from a technical standpoint, FSM is now trading in the upper portion of its expected support/resistance range after this sharp rally, with strong resistance at US$4.60 and no strong support until US$2.20. This doesn’t mean that the stock can’t continue to rally, but when starting new positions in small-cap stocks, I prefer a minimum 5/1 reward-risk ratio. The current ratio is 0.71 to 1.0 based on $1.00 in potential upside to resistance and $1.40 in potential downside to support. So, for Fortuna to become attractive from a technical standpoint, the stock would need to slide back below US$2.60 per share.
Summary
Fortuna has put together a solid year in a challenging operating environment, and the uncertainty overhang at San Jose has been lifted, with the Court issuing a judgment in favor of the company that revoked the typographical error in its 12-year EIA extension. In addition, it has done an exceptional job keeping Seguela on budget and schedule in a period where we’ve seen several capex blowouts sector-wide. That said, the time to buy small-cap producers is when blood is in the streets, and they’re trading at a significant discount to fair value, and this is no longer the case after a 70% plus rally. Hence, I don’t see any way to justify chasing the stock above US$3.70, and I would view any rallies above US$4.00 before year-end as profit-taking opportunities.