First Half Of 2022 Stock Market And Portfolio Update
Matteo Colombo
The first half of 2022 is in the books, and it was not pretty. U.S. stocks delivered their worst showing since 1970. That said, every day forward is another day closer to the end of this bear market. Forward valuations are improving, but the PE ratios may be challenged by a slowing economy and earnings headwinds. Thanks to energy stocks, commodities and the outperformance of Canadian dividend payers, our portfolios are holding up reasonably well.
In a recent Making Sense of the Markets update, I outlined the returns for U.S., Canadian and international assets for the first half of 2022. Here’s a Liz Sonders Tweet that gave the details for U.S. stocks by sector and style.
Go through that MoneySense post, and you’ll find the details for additional assets, plus commentary on the recent economic events and prospects. Of course, it’s all about inflation, and it may come down to a recession or stagflation. And yes, there is the possibility that the Fed can navigate a soft landing, though that is a long shot.
How Did Our U.S. Stocks Hold Up?
For our accounts (my wife and me), we hold the 17 dividend achievers and 3 stock picks. I skimmed 15 of the largest cap dividend achievers (VIG) in early 2015. The list grew to 17 stocks when United Technologies merged with Raytheon (RTX) and spun off OTIS Worldwide (OTIS) and Carrier Global (CARR). That 3-pack has done very well from January of 2021.
Raytheon OTIS and Carrier vs Achievers and S&P 500 (Author, Portfolio Visualizer )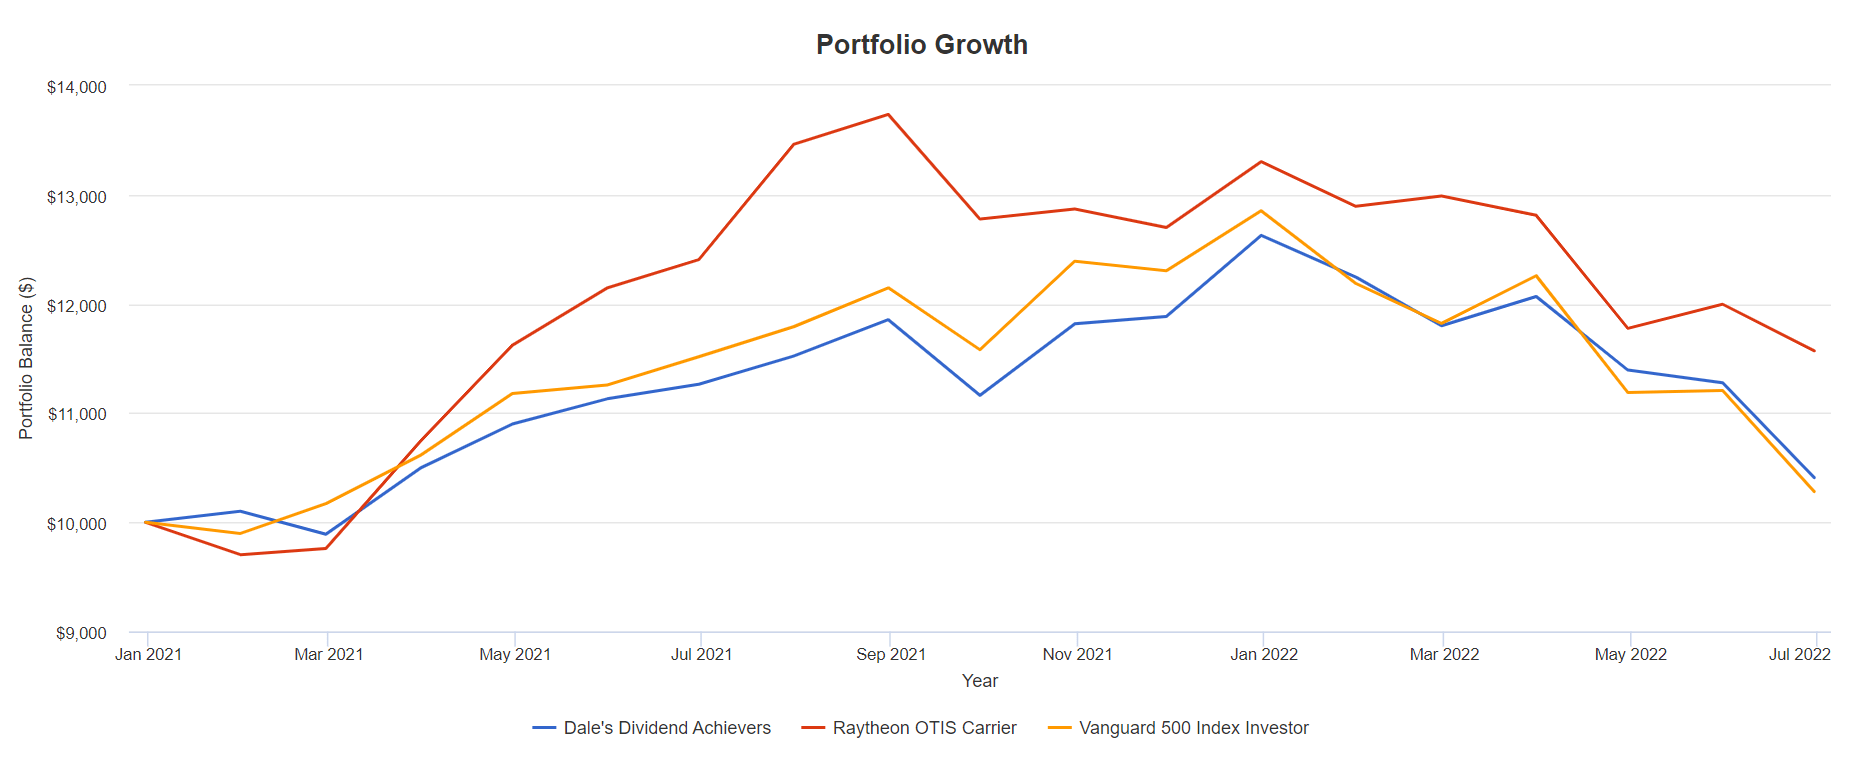
From January of 2021 to the end of June 2022, we can see that our total U.S. portfolio has a slight edge over the S&P 500, with the United Technologies spinoffs delivering in a meaningful way.
The markets have essentially taken a round trip over the last 18 months.
A Very Meaningful Recent Beat
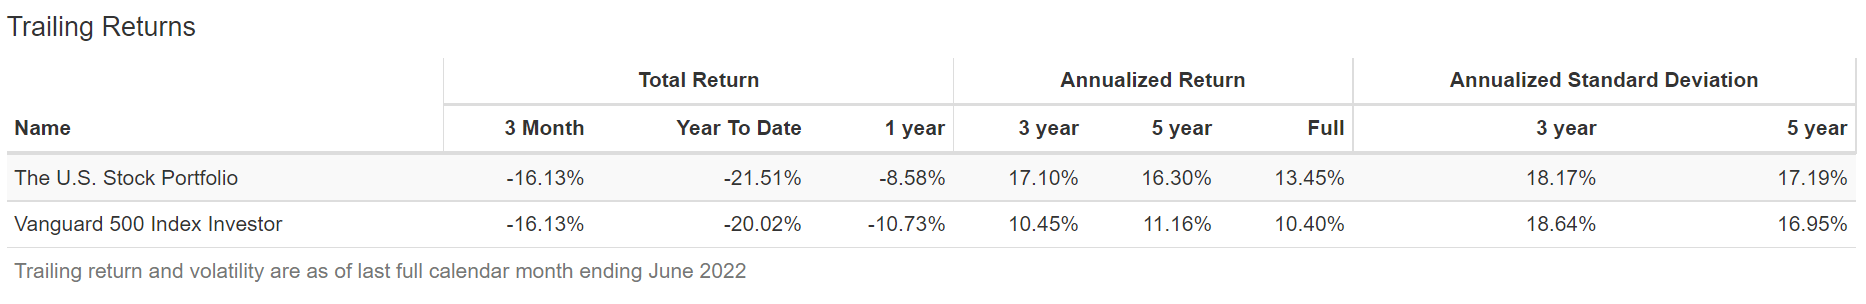
Here are the returns for the entire U.S. stock portfolio, the dividend achievers plus the 3 picks of Apple (AAPL), BlackRock (BLK) and Berkshire Hathaway (BRK.B). The period is from January of 2015 to the end of June 2022.
U.S. Stock Portfolio vs S&P 500 (Author, Portfolio Visualizer ) U.S. Stock Portfolio vs S&P 500 Trailing Returns (Author, Portfolio Visualizer )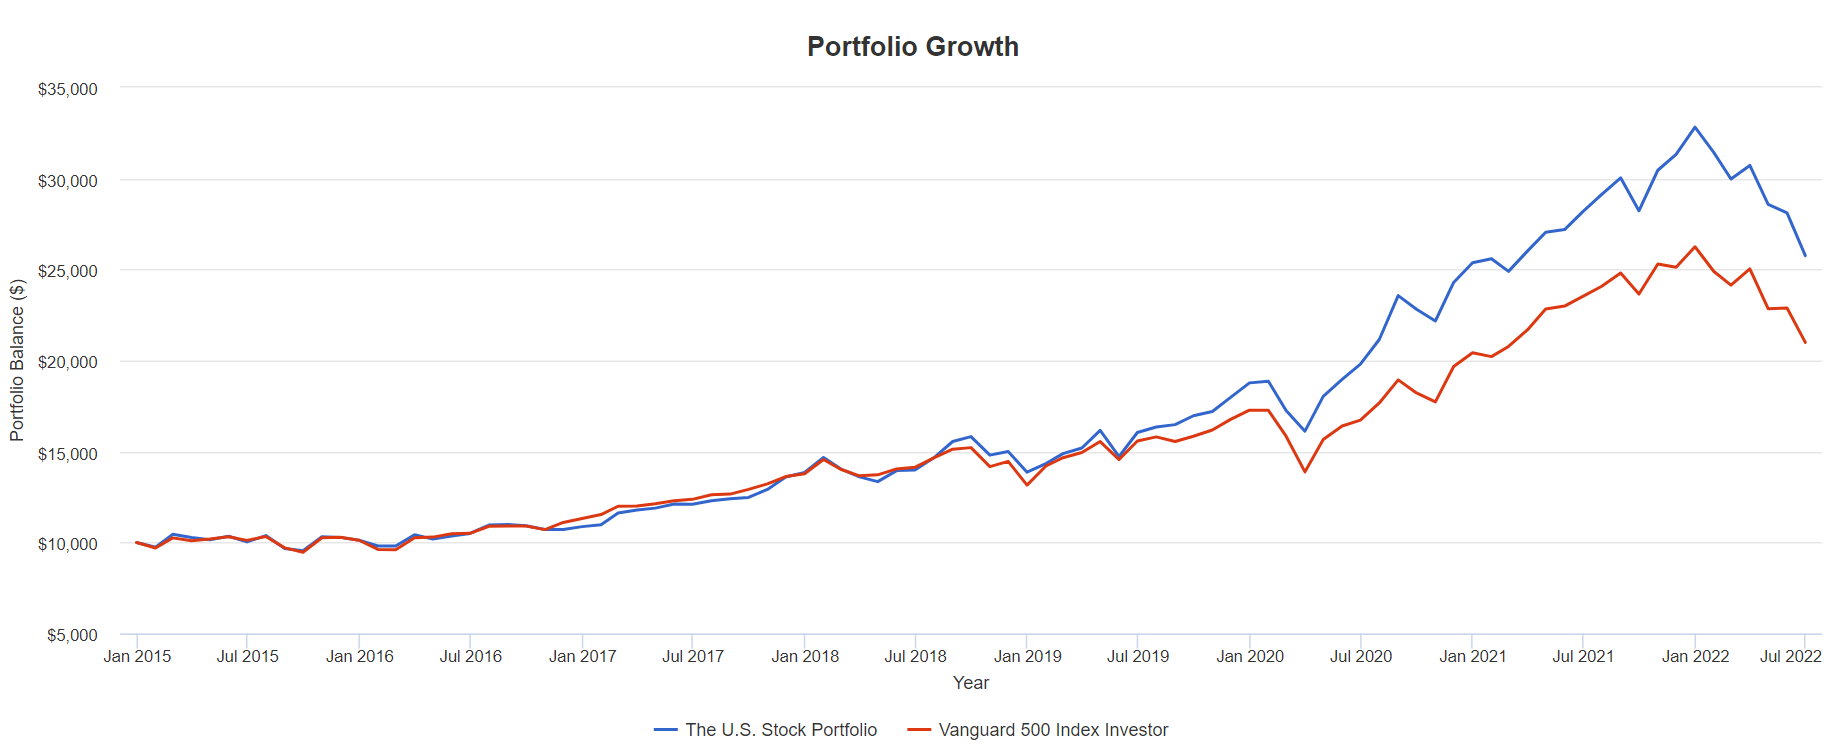
For the above comparison, I removed the spinoffs (not available pre-2021). And as per the previous charts, the spinoffs have added to the recent market beat. As per our true portfolio weightings, Apple and Berkshire are at a double weight.
Here are the returns of the individual stocks, from January of 2015 to the end of June 2022.
Stock returns to June 2022 (Author, Portfolio Visualizer )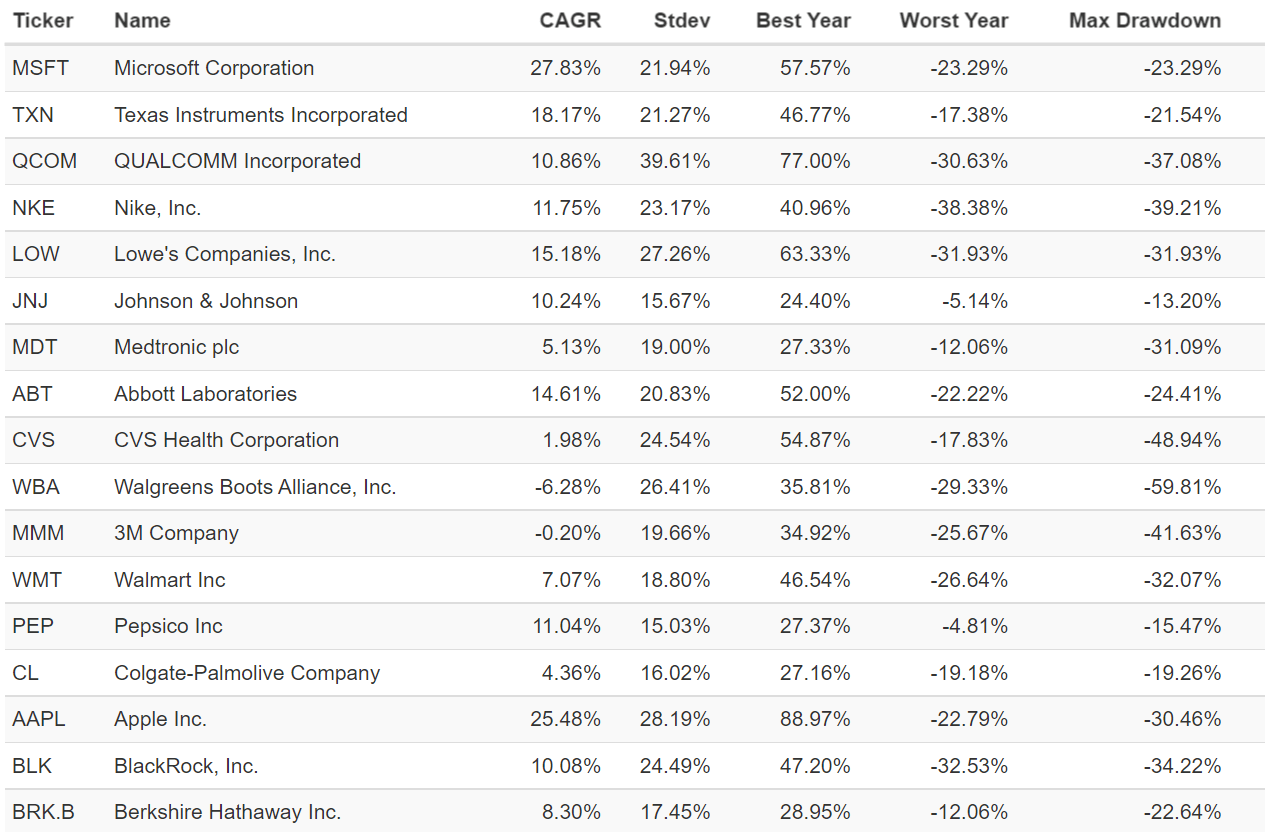
The portfolio outperformance is led by tech and the consumer discretionary stocks. Also, the win rate of the portfolio is very high compared to the market, and most funds. The only loser is Walgreens. 3M has been a laggard and has mostly been in positive territory, though it recently slipped into the red.
While I am a big fan of index investing, the above demonstrates that an investor can build a concentrated portfolio. In fact, I recently looked back with…
If I could only own 10 stocks.
That was a 10-stock portfolio idea put forth in early 2019. The concentrated portfolio more than achieved its goals. Have a read, that was a popular post, and an editor’s pick.
Our Canadian Stocks
Here’s a recent update on our Canadian dividend portfolio.
Let’s look at the Canadian Wide Moat 7 from January of 2021 through to the end of June 2022.
Canadian Wide Moat 7 vs S&P 500 (Author, Portfolio Visualizer )
The Canucks have delivered at a CAGR of 18.3% vs. 1.9% for U.S. stocks.
The Canadian Wide Moat 7 is essentially flat in 2022, though we have been helped by our Canadian energy stocks. The Wide Moat plus energy (at 10% weighting) combination has delivered positive returns in 2022.
In March of 2021, I had suggested that U.S. investors consider Canadian stocks. The valuation story was simple and obvious. It was (and is) even more obvious for energy stocks.
Here’s the performance of the wide moat stocks from January of 2015 to the end of June 2022.
Wide Moat vs S&P 500 from 2015 (Author, Portfolio Visualizer )
For the period:
- Canadian Wide Moat 8.4% CAGR
- S&P 500 10.4% CAGR
There has been a nice opportunity to rebalance from U.S. stocks to Canadian stocks into 2020. The Canadian stocks are performing well in the current stagflationary environment. They are more inflation and stagflation friendly.
Keep in mind that Canadian stocks greatly outperformed through the stagflation of the 70s, through the dot-com crash of the early 2000s and through the financial crisis.
From 2015, here is the performance of the Canadian stocks.
Canadian Wide Moat Stocks (Author, Portfolio Visualizer )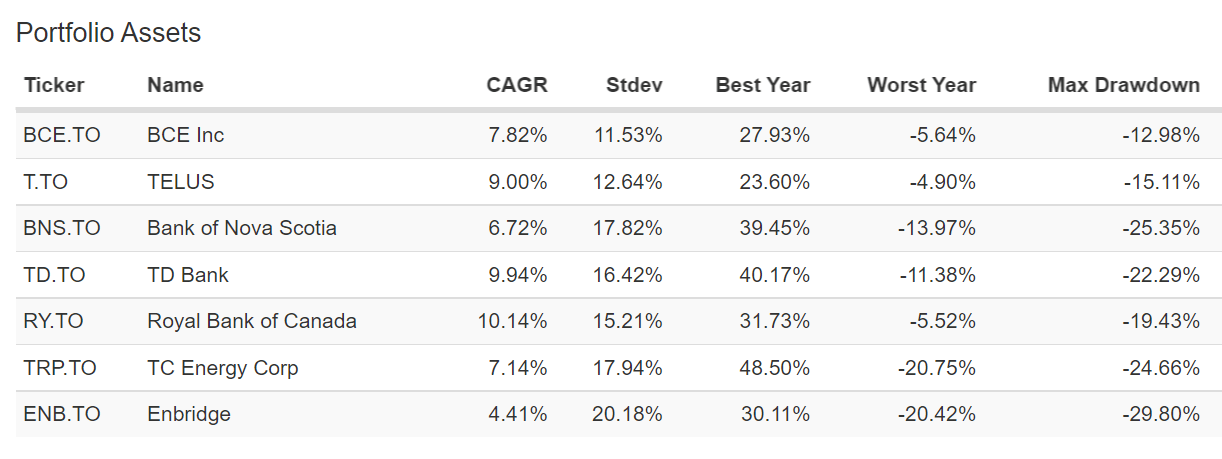
We can see that they are all delivering in a very solid fashion. Also, we have experienced no dividend cuts with our Canadian or U.S. stocks. We still have a perfect dividend record.
And for the retiree or semi-retiree, the Canadian stocks deliver a wonderful income source. The following does not include dividend reinvestment.
Wide Moat 7 Dividend Growth (Author, Portfolio Visualizer )
From 2015, the portfolio would have started with a 4.1% yield, increasing to 6.2% in 2021. 2022 has delivered dividend increases across the board. The dividend growth rate is 8.5%. That is a very generous annual raise for the retiree.
For the energy component of our holdings, I took the generous profits in the oil and gas index ETFs and moved to an energy dividend approach.
Eric Nuttall of Ninepoint Partners is confident that we are in a golden era of free cashflow and dividend growth for oil and gas producers. Especially for the Canadian producers.
As a semi-retiree, I like the idea of a core dividend growth income stream from our…
Canadian Wide Moat 7 + Canadian Energy + U.S. dividend achievers
Total return is also important, so homemade dividends will be a part of the retirement income strategy. That is, we’ll sell shares to create income. To manage the sequence of returns risk, we hold a modest amount of bonds and cash in the area of a 15% – 20% allocation for accounts.
Positive Returns Over 1-year
Given the exposure to Canadian stocks and energy, and other commodities, our accounts are in positive territory over the last year. My personal retirement account is up over 4% according to TD Direct, our discount brokerage. Again, U.S. stocks are down almost 10%. International stocks are down by 20%.
There has not been much to sweat with this asset mix. That said, our portfolios have fallen by near 10% from their recent peaks.
Certainly, our portfolios might fall much more in a serious recession. The portfolios should hold up well enough if stagflation sticks around.
In any recession, I will look forward to rebalancing to energy dividend payers. And, of course, I am very interested in rebalancing to our U.S. holdings when or if outrageous value presents itself. I will be greedy.
While Canada offers the most durable dividends on the planet, the U.S. holds the best companies on the planet, in my opinion. It is a wonderful combination.
Thanks for reading. We’ll see you in the comment section. How was your first half of 2022?