Eaton Vance EXD ETF: Options Strategy Providing Some Reprieve (NYSE:EXD)
Lemon_tm/iStock via Getty Images
Written by Nick Ackerman, co-produced by Stanford Chemist. This article was originally published to members of the CEF/ETF Income Laboratory on June 24th, 2022.
Eaton Vance Tax-Managed Buy-Write Strategy Fund (NYSE:EXD) is having a challenging year, similar to much of the broader market. However, the fund’s options strategy of writing calls on indexes has helped dampen some of the downside experienced. EXD benchmarks against both the S&P 500 Index and the Nasdaq 100 Index.
Looking at the YTD performance between EXD and the SPDR S&P 500 Trust ETF (SPY) and the Invesco QQQ Trust (QQQ) gives us an idea of how the fund is performing relatively. On a total NAV return basis, it has held up the best. Interestingly, it has followed quite closely with SPY. This performance was well above the QQQ performance. On the other hand, the total share price returns have been weaker. That has led to a small discount opening up in the shares lately.
YCharts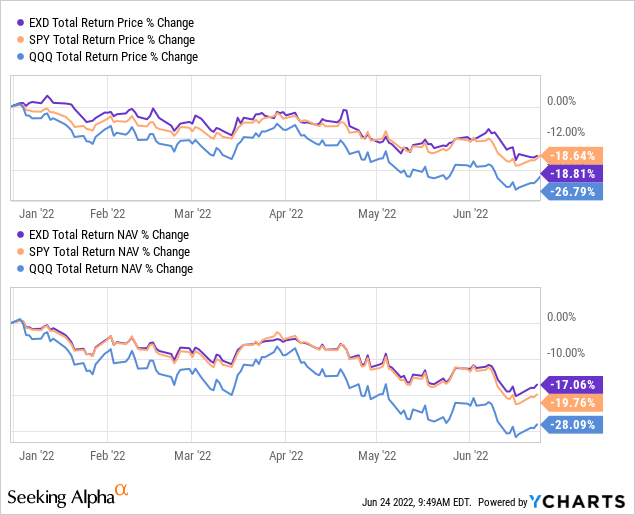
The discount itself isn’t presenting a particularly attractive buying point nor reflects a level where one should avoid the name. The decline is an attractive time for investors to start putting capital to work. The attractively high distribution yield is also a bonus. I don’t see it at any particular risk of cutting for the time being. Though this will be something to consider if markets drop even further and stay lower for longer.
The Basics
- 1-Year Z-score: -1.31
- Discount: 0.73%
- Distribution Yield: 8.90%
- Expense Ratio: 1.21%
- Leverage: N/A
- Managed Assets: $93.7 million
- Structure: Perpetual
EXD’s strategy is to “invest in a diversified portfolio of common stocks and write call options on one or more U.S. indices on a substantial portion of the value of its common stock portfolio to seek to generate current earnings from the option premium. The Fund’s portfolio managers use the adviser’s and sub-advisers internal research and proprietary modeling techniques in making investment decisions. The Fund evaluates returns on an after-tax basis and seeks to minimize and defer federal income taxes incurred by shareholders in connection with their investment in the Fund.”
EXD is on the smaller side, even for closed-end funds. This can be a risk to larger investors that need a lot of liquidity. It is just over $93.7 million in total managed assets. It was making its way towards becoming a larger fund before the losses of 2022 sent it back in the other direction. We were near $110 million in managed assets in my previous update. For a larger fund that’s virtually similar, one could consider its ~$1.341 billion sister, Eaton Vance Tax-Managed Buy-Write Opportunities Fund (ETV).
The fund’s absence of leverage can make it a better fit for risk-averse investors. This could be especially helpful as we continue to head through a rate hiking cycle. Leveraged CEFs will often have floating rate leverage, increasing their leverage costs as interest rates rise.
Performance – Declines Present An Opportunity
The fact that tech has been hit particularly hard, but EXD has still been able to thwart some of the downside here is impressive. During sharp declines, we often see no or very limited downside protection from these option writing funds. Often, they are the most successful during times of mostly flattish markets or sideways markets.
However, since this decline has been more prolonged and not as sharp as something like 2020, I think we are seeing some downside protection here. EXD wasn’t the only fund that I’ve seen holding up relatively better. BlackRock Enhanced Capital and Income Fund (CII) was exhibiting similar defensiveness.
At the same time, the declines have been a bit deeper on the share price performance side of the equation. That pushed the fund back into a discount when it was trading at premiums for most of the last year. Essentially, the fund as we see it today hadn’t really begun until February 8th, 2019. At that time, the name and strategy changed.
So all the data prior to that point is even more irrelevant than using historical data to gauge future returns. Past performance is never a guarantee of future returns, but it can at least give us a track record or an idea of how a fund performed during a certain time. For EXD, we don’t really have that unless we look at its sister fund ETV.
Since its transformation, we have seen the fund gradually chip away at its discount. That is except for the period of 2020 when the market went into panic mode. It then resumed the slow chisel away at its discount until it breached into premium territory.
YCharts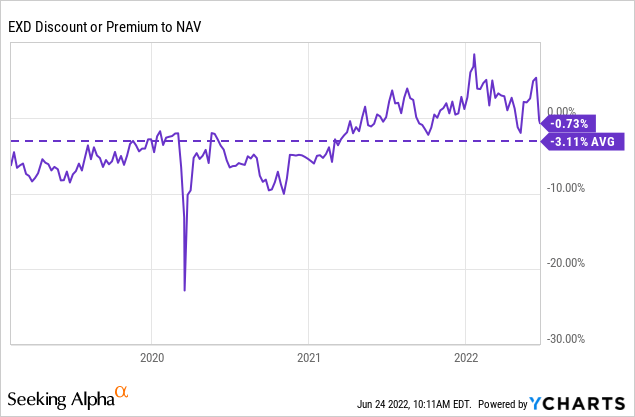
Now, the fund is still trading above its average during this period. However, ETV has been shown to trade at a rather persistent premium since 2014. EXD being the clone of ETV, I don’t think it is a stretch that it inherits that premium gene. Meaning that the current level of the discount/premium seems rather appropriate or about where it should trade at. It is simply the actual declines more broadly that have pushed most of the market into bear territory, presenting the buying opportunity here more so than the actual valuation of the CEF.
Distribution – High Distribution Yield
For CEFs, it’s all about the distributions they can spin off. Eaton Vance raised several of the distributions for their funds in 2021. Unfortunately, with the market deterioration since then, I believe several are at risk of needing trims.
EXD Distribution History (CEFConnect)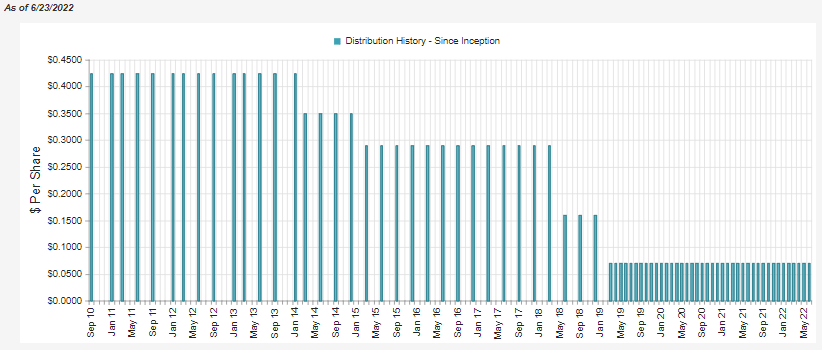
EXD did not get its distribution boosted, but I believe that leaves it in a better situation for maintaining what it is paying out now. Again, on the chart above, note that before 2019, it isn’t really the EXD we know and love today.
At this time, the distribution yield works out to 8.90%. It comes to a similar 8.83% on a NAV basis due to being priced right near its NAV. Since the fund leans into tech positioning as its heaviest allocation, we see a lack of total investment income in the portfolio. That means that capital gains will be the primary driver of the distribution in terms of earning the distribution.
EXD Annual Report (Eaton Vance)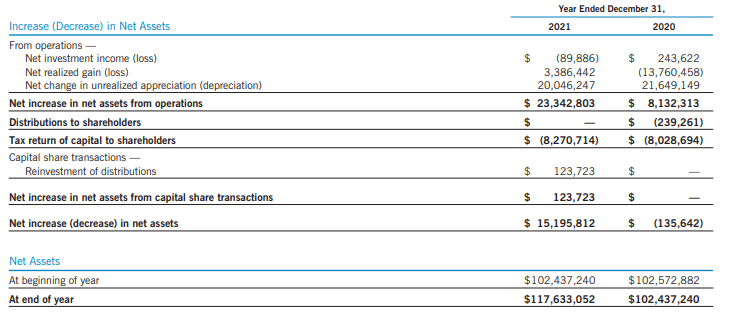
In fact, after the fund’s expenses are paid, net investment income or NII turns into net investment loss or NIL.
There is where it can get a little confusing. Investors want to blur the lines of earnings and distribution tax classifications. The fund has a strategy of writing calls on indexes. These are cash-settled, so they can generate losses when indexes rise. That’s often the case. When the market is rising, this fund’s options strategy generates losses.
In the year 2021, the option strategy generated a loss of $6 million in capital losses for the fund. On the other hand, the fund realized around $9.4 million in gains. That resulted in the fund only generating net realized gains of around $3.386 million.
EXD Annual Report (Eaton Vance)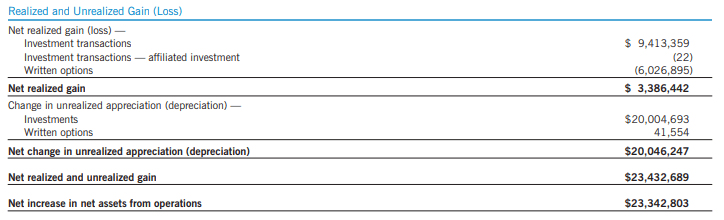
At the same time, the unrealized gains on the portfolio of over $20 million meant that the ~$8.271 million paid to investors was “covered.”
Thus, the fund’s NAV rose, and we would consider the distribution being covered for EXD in 2021.
That’s where the tax classification on the distribution comes in. Return of capital is often a large component of the distribution tax breakdown. In fact, the entire distribution was characterized as return of capital for the fund in 2021.
EXD Tax Classifications (Eaton Vance)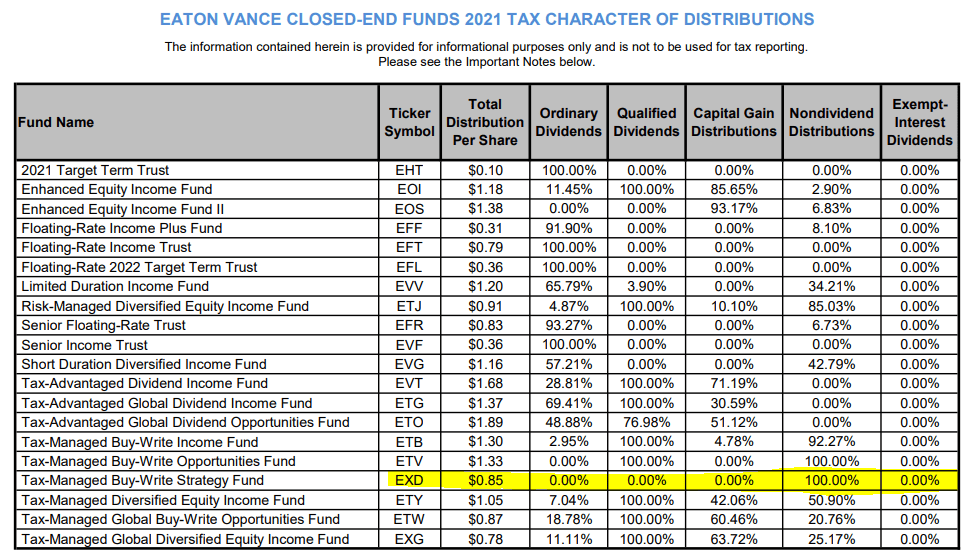
The ROC here is why the fund is tax-managed in the first place. ROC isn’t being used destructively here and eroding the fund. However, at the same time, it defers tax obligations for investors as it reduces an investor’s cost basis. Therefore, the taxes aren’t due until the fund is sold, and then an investor would potentially realize a capital gain. Ideally, if they held long enough, it would be a long-term capital gain.
With indexes declining this year, they should realize gains from these options trades. That should be helping to maintain the distribution for the year while the underlying portfolio declines. It should also be why we are seeing funds such as EXD outperforming their benchmarks. We will get confirmation on this when the next Semi-Annual Report is posted.
Unfortunately, that posting isn’t expected to be public until towards the end of August. This is where I’d really enjoy it if Eaton Vance provided some quarterly updates on the numbers that some other CEFs do. I understand why they don’t. For one, it isn’t required. For two, it would just add additional costs.
EXD’s Portfolio
Since the fund has a tilt towards tech with its Nasdaq 100 benchmark, the portfolio’s highest sector allocation is often tech. At the end of 2021, it amounted to 37.2% of the fund’s assets. Looking at the top ten in the portfolio, it is quite easy to see that this overweight tech allocation remains.
EXD Top Ten (Eaton Vance)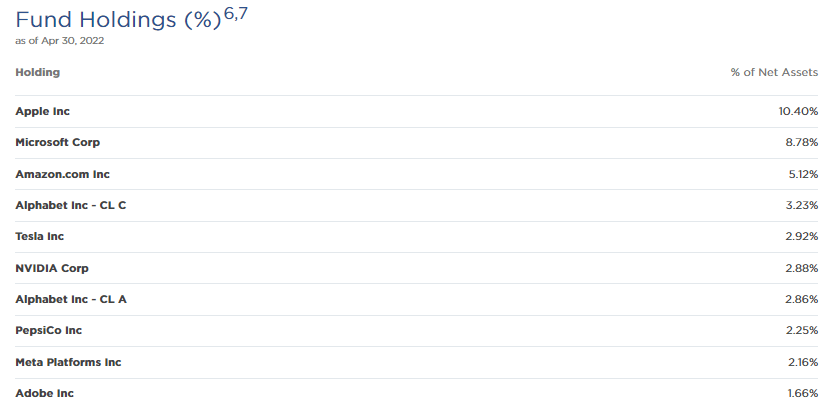
The top ten itself represents 42.26% of the portfolio. That makes the portfolio quite concentrated towards the top. As we can see, the top three alone make up nearly a quarter of the portfolio at 24.3% exposure.
At the end of Q1 2022, they listed 148 total positions. That really puts the bottom half of the portfolio at an almost meaningless weighting. It’s also significantly less than the 500 company exposure that the S&P 500 has itself. Running a more narrowed portfolio can also help explain some of the outperformance this year. The top names here are most of the mega-cap tech names. Several of these held up relatively well when compared to the broader index.
On a YTD basis, Apple (AAPL), Microsoft (MSFT) and Google (GOOG)(GOOGL) held up better than the QQQ. Amazon (AMZN) and, in particular, Meta Platforms (META) were hit relatively harder.
YCharts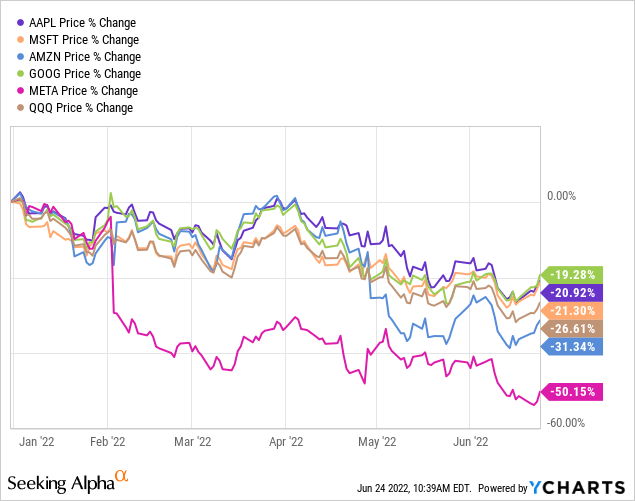
Overall, there have been no changes in the top ten from our previous update.
Conclusion
EXD has now come to a small discount, but that isn’t particularly a huge selling point now. It is the fact that it is more attractively priced as valuations across the board have come down. At the same time, the portfolio positioning and options strategy seems to have generated a bit of downside protection. That’s what makes it more of an interesting play to consider adding to the position at this time. During times of volatility, such as in 2022, it can be more appropriate to dollar-cost average your way in.