Community Trust Bancorp Stock: Upgrading To Buy (NASDAQ:CTBI)
RiverNorthPhotography
Earnings of Community Trust Bancorp, Inc. (NASDAQ:CTBI) will likely remain flattish this year. Subdued loan growth and slight margin expansion will lift the top line. However, an increase in operating expenses will counter the effect of topline growth. Overall, I’m expecting Community Trust Bancorp to report earnings of $4.61 per share for 2023, up by just 1% year-over-year. Compared to my last report on the company, I’ve barely changed my earnings estimate. The December 2023 target price suggests a moderately-high upside from the current market price. Therefore, I’m upgrading CTBI stock to a buy rating.
At Least Half the Loan Portfolio has a Bleak Outlook
Community Trust Bancorp’s loan portfolio grew by a decent 2.2% in the last quarter, or 8.6% annualized. The full-year growth was much higher than in most previous years. Going forward, I’m expecting loan growth to fall from this exceptionally high level.
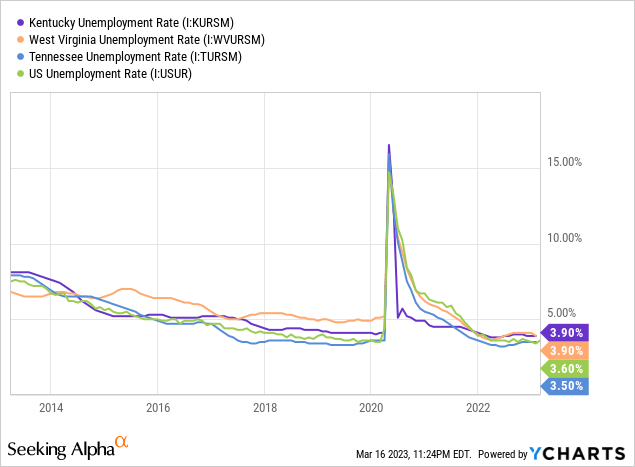
Community Trust Bancorp has a well-diversified loan portfolio by loan type. Commercial loans make up 50% of total loans, residential loans make up 25%, and consumer loans make up the remaining 25% of total loans. Geographically, however, the portfolio’s loans are concentrated in Kentucky. Community Trust Bancorp also has some exposure to West Virginia and Tennessee.
The outlook for both consumer and residential loans is negative. The consumer confidence index declined once again in February, according to the Conference Board, which bodes ill for the demand for consumer loans. Further, the growth of residential loans will suffer due to elevated mortgage rates. Moreover, home prices in Kentucky continue to be high despite the dip in the latter part of last year.

Meanwhile, the outlook for commercial loans is not bad. The unemployment rates in Community Trust Bancorp’s markets continue to be low.
However, the trendline for Kentucky’s economic activity has flattened recently, which is bad news for loan growth.
The Federal Reserve Bank of Philadelphia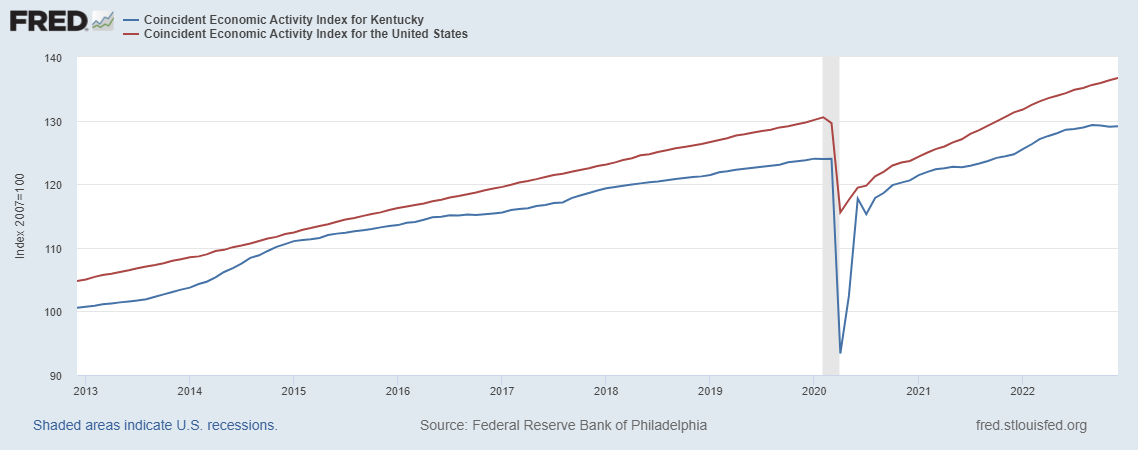
Considering these factors, I’m expecting the loan portfolio to grow by 3% in 2023. In my last report on the company, I estimated loan growth of 4% for the year. As my outlook is now worse than before, I’ve decided to reduce my growth estimate for 2023.
Meanwhile, I’m expecting deposits to grow mostly in line with loans. The following table shows my balance sheet estimates.
| Financial Position | FY18 | FY19 | FY20 | FY21 | FY22 | FY23E |
| Net Loans | 3,173 | 3,214 | 3,506 | 3,367 | 3,663 | 3,774 |
| Growth of Net Loans | 2.8% | 1.3% | 9.1% | (4.0)% | 8.8% | 3.0% |
| Other Earning Assets | 679 | 810 | 1,307 | 1,726 | 1,336 | 1,363 |
| Deposits | 3,306 | 3,406 | 4,016 | 4,344 | 4,426 | 4,560 |
| Borrowings and Sub-Debt | 294 | 308 | 429 | 331 | 278 | 283 |
| Common equity | 564 | 615 | 655 | 698 | 628 | 658 |
| Book Value Per Share ($) | 31.9 | 34.7 | 36.9 | 39.2 | 35.2 | 36.9 |
| Tangible BVPS ($) | 28.2 | 31.0 | 33.2 | 35.5 | 31.5 | 33.2 |
| Source: SEC Filings, Author’s Estimates(In USD million unless otherwise specified) | ||||||
Loan Mix to Help the Margin Continue to Expand
Community Trust Bancorp’s net interest margin expanded by 15 basis points in the fourth quarter after it grew by 16 basis points in the third quarter of last year. The ongoing up-rate cycle was the biggest factor that contributed to the margin expansion. Community Trust Bancorp’s moderate rate sensitivity is attributable to a large balance of adjustable-rate commercial loans, which made up 48% of total loans at the end of December 2022, as mentioned in the 10-K filing. Additionally, commercial loans with predetermined rates that will mature within one year made up 1.2% of total loans.
The results of the management’s rate-sensitivity analysis given in the 10-K filing showed that a 200-basis points hike in interest rates could increase the net interest income by 4.6% over twelve months.
2022 10-K Filing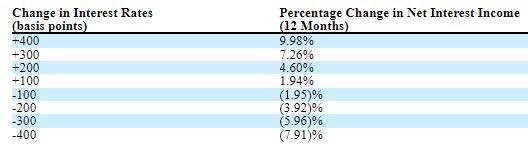
Considering these factors, I’m expecting the net interest margin to increase by ten basis points in 2023.
Expecting Flattish Earnings for this Year
The anticipated loan growth and slight margin expansion will support earnings growth this year. On the other hand, inflation will drive up non-interest expenses, which will limit earnings growth. As a result, I’m expecting Community Trust Bancorp to report earnings of $4.61 per share for 2023, up by just 1% year-over-year. The following table shows my income statement estimates.
| Income Statement | FY18 | FY19 | FY20 | FY21 | FY22 | FY23E |
| Net interest income | 142 | 145 | 151 | 163 | 169 | 185 |
| Provision for loan losses | 6 | 5 | 16 | (6) | 5 | 6 |
| Non-interest income | 52 | 50 | 55 | 60 | 58 | 55 |
| Non-interest expense | 117 | 118 | 119 | 119 | 121 | 131 |
| Net income – Common Sh. | 59 | 65 | 60 | 88 | 82 | 82 |
| EPS – Diluted ($) | 3.35 | 3.64 | 3.35 | 4.94 | 4.58 | 4.61 |
| Source: SEC Filings, Earnings Releases, Author’s Estimates(In USD million unless otherwise specified) | ||||||
In my last report on Community Trust Bancorp, I estimated earnings of $4.68 per share for 2023. My earnings estimate is barely changed as the tweaks I’ve made in all line items cancel mostly each other out.
Unrealized Losses Make the Risk Level Higher than Usual
Community Trust Bancorp has sizable unrealized mark-to-market losses on its securities portfolio. These losses amounted to $168 million at the end of December 2022, which is around 27% of the total equity. If, like the SVB Financial’s (SIVB) case, big depositors line up to withdraw their deposits, then Community Trust Bancorp may be forced to sell some of its securities at loss. However, this is a very unlikely scenario as, unlike SIVB, CTBI does not cater to a niche market. As mentioned above, its books are well-diversified. Further, Community Trust does not have any exposure to Silicon Valley and California, unlike SIVB. Most probably, Community Trust Bancorp, like peer banks, will ride out the current rate environment and reverse the unrealized losses once rates start to rise.
Furthermore, Community Trust does not mention any exposure to crypto assets or digital tokens in its SEC filings. Crypto assets were the reason behind the fall of Silvergate Capital (SI).
Upgrading to a Buy Rating
Community Trust Bancorp has been increasing its dividend annually in the third quarter for more than a decade. Based on my earnings outlook, I’m expecting Community Trust to increase its dividend by $0.02 per share in the third quarter of 2023 to $0.46 per share. My earnings and dividend estimates suggest a payout ratio of 39% for 2023, which is in line with the last five-year average of 41%. My dividend estimate suggests a forward dividend yield of 4.5%.
I’m using the historical price-to-tangible book (“P/TB”) and price-to-earnings (“P/E”) multiples to value Community Trust Bancorp. The stock has traded at an average P/TB ratio of 1.24 in the past, as shown below.
| FY19 | FY20 | FY21 | FY22 | Average | ||
| T. Book Value per Share ($) | 31.0 | 33.2 | 35.5 | 31.5 | ||
| Average Market Price ($) | 42.1 | 34.4 | 42.3 | 43.0 | ||
| Historical P/TB | 1.36x | 1.04x | 1.19x | 1.37x | 1.24x | |
| Source: Company Financials, Yahoo Finance, Author’s Estimates | ||||||
Multiplying the average P/TB multiple with the forecast tangible book value per share of $33.2 gives a target price of $41.1 for the end of 2023. This price target implies a 2.0% upside from the March 16 closing price. The following table shows the sensitivity of the target price to the P/TB ratio.
| P/TB Multiple | 1.04x | 1.14x | 1.24x | 1.34x | 1.44x |
| TBVPS – Dec 2023 ($) | 33.2 | 33.2 | 33.2 | 33.2 | 33.2 |
| Target Price ($) | 34.5 | 37.8 | 41.1 | 44.4 | 47.7 |
| Market Price ($) | 40.3 | 40.3 | 40.3 | 40.3 | 40.3 |
| Upside/(Downside) | (14.5)% | (6.2)% | 2.0% | 10.3% | 18.5% |
| Source: Author’s Estimates |
The stock has traded at an average P/E ratio of around 9.9x in the past, as shown below.
| FY19 | FY20 | FY21 | FY22 | Average | ||
| Earnings per Share ($) | 3.64 | 3.35 | 4.94 | 4.58 | ||
| Average Market Price ($) | 42.1 | 34.4 | 42.3 | 43.0 | ||
| Historical P/E | 11.6x | 10.3x | 8.6x | 9.4x | 9.9x | |
| Source: Company Financials, Yahoo Finance, Author’s Estimates | ||||||
Multiplying the average P/E multiple with the forecast earnings per share of $4.61 gives a target price of $45.8 for the end of 2023. This price target implies a 13.7% upside from the March 16 closing price. The following table shows the sensitivity of the target price to the P/E ratio.
| P/E Multiple | 7.9x | 8.9x | 9.9x | 10.9x | 11.9x |
| EPS 2023 ($) | 4.61 | 4.61 | 4.61 | 4.61 | 4.61 |
| Target Price ($) | 36.6 | 41.2 | 45.8 | 50.4 | 55.0 |
| Market Price ($) | 40.3 | 40.3 | 40.3 | 40.3 | 40.3 |
| Upside/(Downside) | (9.1)% | 2.3% | 13.7% | 25.2% | 36.6% |
| Source: Author’s Estimates |
Equally weighting the target prices from the two valuation methods gives a combined target price of $43.5, which implies a 7.9% upside from the current market price. Adding the forward dividend yield gives a total expected return of 12.3%.
In my last report on Community Trust Bancorp, I adopted a hold rating as my target price and dividend estimate implied only a 7.5% total expected return at that time. Since then, the stock price has corrected, leaving a larger price upside. As a result, I’m upgrading Community Trust Bancorp to a buy rating.